Figures & data
Figure 1 Dietary fish oil increases the number of CD11b+CD27− NK cells in peritoneum of mice 6 h after inflammation induction. Mice were fed control (Ctr, grey line with grey circles) or fish oil (Fo, black line with black squares) diets for 5 weeks. They were immunized twice with mBSA with a 2-week interval and subsequently challenged intraperitoneally. Mice were sacrificed at 0, 1.5, 3, and 6 h following challenge and peritoneal cells collected. Peritoneal cells were counted with a Countess automated cell counter, stained with monoclonal antibodies against CD3, NK1.1, CD49b (DX5), CD11b and CD27 and evaluated by flow cytometry. Representative gating strategy on CD3− lymphocytes to identify NK cells based on their NK1.1 and CD49b (DX5) expression (A) and separation of NK cells into 4 distinct subtypes based on their CD27 and CD11b expression (B) 6 h after inflammation induction in mice fed either Ctr or Fo diets. Number of CD3−NK1.1+CD49b (DX5)+ lymphocytes at different timepoints following induction of inflammation (C) and of those the number of CD11b−CD27−, CD11b−CD27+, CD11b+CD27+, and CD11b+CD27− cells at 6 h after inflammation induction (D). *p < 0.05, ***p < 0.001. n = 9–12 for the 0 and 3 h time-points and 35–48 for 6 h post-challenge. Results are shown as mean ± standard error of the mean from data collected from at least four independent experiments.
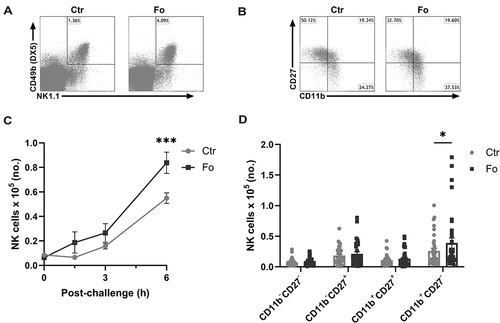
Figure 2 Dietary fish oil increases the number of CCR5+ NK cells and enhances CCL5 and CXCL12 concentrations in peritoneum 6 h after induction of inflammation. Mice were fed control (Ctr, grey line with grey circles) or fish oil (Fo, black line with black squares) diets for 5 weeks. They were immunized twice with mBSA with a 2-week interval and subsequently challenged intraperitoneally. Mice were sacrificed at 0, 1.5, 3, and 6 h following challenge and peritoneal lavage collected. Peritoneal cells were counted with a Countess automated cell counter, stained with monoclonal antibodies against CD3, NK1.1, CD49b (DX5), and CCR5 and analyzed by flow cytometry. Representative dot plots of NK cell expression of CCR5 in mice receiving Ctr and Fo diets 6 h after inflammation induction (A). Number of CCR5+ NK cells at 0, 1.5, 3, and 6 h (B) and peritoneal concentrations of CCL5 and CXCL12 6 h (C) following inflammation induction in mice receiving Ctr and Fo diets. ***p < 0.001, n = 8–15 (B) and n = 47–50 (C). Results are shown as mean ± standard error of the mean from data collected from at least four independent experiments.
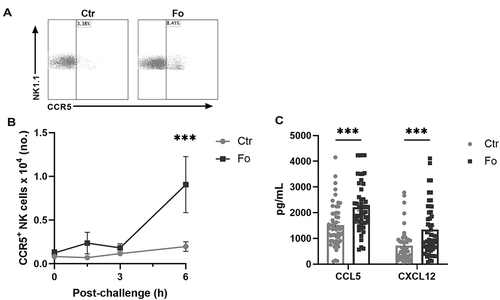
Figure 3 Dietary fish oil increases NK cell expression of CD107a and the proportion of NK cells that express CD107a but decreases the proportion of NK cells expressing CD62L. Mice were fed control (Ctr, grey line with grey circles) or fish oil (Fo, black line with black squares) diets for 5 weeks. They were immunized twice with mBSA with a 2-week interval and subsequently challenged intraperitoneally. Mice were sacrificed at 6 h following challenge and peritoneal cells collected, counted with a Countess automated cell counter, stained with monoclonal antibodies against CD3, NK1.1, CD49b (DX5), CD107a, and CD62L, and evaluated by flow cytometry. Representative dot plots of CD107a (A) and CD62L (B) expression on NK cells in mice receiving Fo and Ctr diets 6 h after inflammation induction. Expression levels (MFI) and percentages of CD107a+ (C) and CD62L+ (D) NK cells 6 h following induction of inflammation. *p < 0.05, **p < 0.01; n = 13–14. Results are shown as mean ± standard error of the mean from data collected from at least four independent experiments.
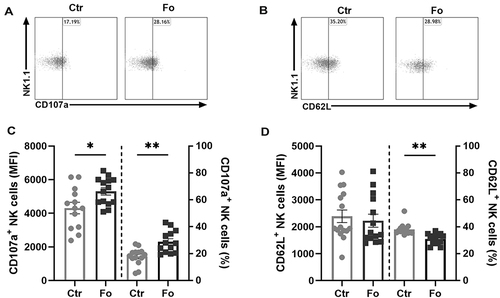
Figure 4 Dietary fish oil shortens the resolution interval, enhances neutrophil apoptosis and egress to draining lymph nodes but decreases neutrophil CD47 expression. Mice were fed control (Ctr, grey lines with grey circles) or fish oil (Fo, black lines with black squares) diets for 5 weeks. They were immunized twice with mBSA with a 2-week interval and challenged intraperitoneally. Mice were sacrificed at 0, 1.5, 3, 6, and 12 h post-challenge and peritoneal cells and mesenteric lymph nodes harvested. Peritoneal cells were stained with monoclonal antibodies against CXCR2, Ly6G, and CD47. Apoptotic neutrophils were stained with FITC-labeled annexin V (AnxV). Neutrophils were defined as CXCR2+Ly6G+ granulocytes. Representative dot plots of neutrophil gating strategy (A), AnxV+ neutrophils (B) and CD47+ neutrophils (C) 6 h after inflammation induction in mice fed either Ctr or Fo diets. Neutrophil numbers with time after inflammation induction in mice fed Ctr and Fo diets determining the infiltration peak (Ψmax), peak infiltration time (Tmax), half the peak neutrophil number (Ψ1/2) and the time when neutrophil numbers reach half Ψmax (T1/2) to determine the resolution interval (Ri), n = 6–12 for 0, 3 and 12 h and 47–50 for the 6 h time-point (D). Percent neutrophils stained with AnxV (E) or CD47 (F) 6 h after inflammation induction in mice fed Ctr and Fo diets, n = 6 for all time-points. Representative TUNEL staining of mesenteric lymph nodes from mice fed Ctr or Fo diets at 3 and 6 h following inflammation induction (G). TUNEL+ cells in all stained lymph nodes from mice fed Ctr and Fo diets, n = 6 for the 3 h time-point and 14 for 6 h post-challenge (H). **p < 0.01, ***p < 0.001, n = 6–40. Results are shown as mean ± standard error of the mean from data collected from at least two independent experiments.
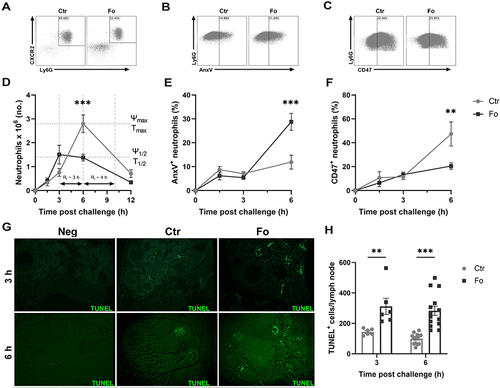
Figure 5 Dietary fish oil decreases peritoneal concentrations of pro-inflammatory chemokines and cytokines. Mice were fed control (Ctr, grey line with grey circles) or fish oil (Fo, black line with black squares) diets for 5 weeks. They were immunized twice with mBSA with a 2-week interval and subsequently challenged intraperitoneally. Mice were sacrificed at 0, 1.5, 3, and 6 h following challenge, peritoneal fluid collected and concentrations of CXCL1 (A), CXCL2 (B), TNF-α (C), IL-33 (D), and IL-6Rα (F) measured by Luminex and that of IL-6 (E) by ELISA. *p < 0.05, **p < 0.01, ***p < 0.001; n = 12 for 0 and 3 h and 40 for the 6 h post-challenge. Results are shown as mean ± standard error of the mean from collected from at least four independent experiments.
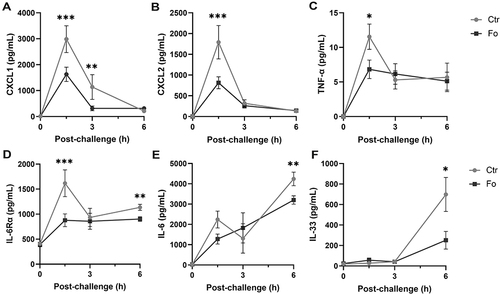
Figure 6 Dietary fish oil enhances peritoneal concentrations of anti-inflammatory cytokines and growth factors. Mice were fed control (Ctr, grey line with grey circles) or fish oil (Fo, black line with black squares) diets for 5 weeks. They were immunized twice with mBSA with a 2-week interval and subsequently challenged intraperitoneally. Mice were sacrificed at 0, 1.5, 3, and 6 h following challenge and peritoneal fluid collected. Concentrations of IL-10 (A), IGF-1 (C), and sTNF RII (D) were determined by Luminex and TGF-β (B) by ELISA. **p < 0.01, ***p < 0.001, n = 8 for 0 and 3 h, 40 for 6 h post-challenge (A, C, and D) and 3–8 for all time-points (B). Results are shown as mean ± standard error of the mean from data collected over at least two independent experiments.
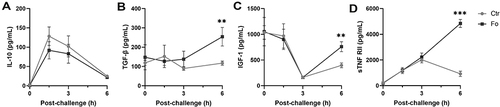
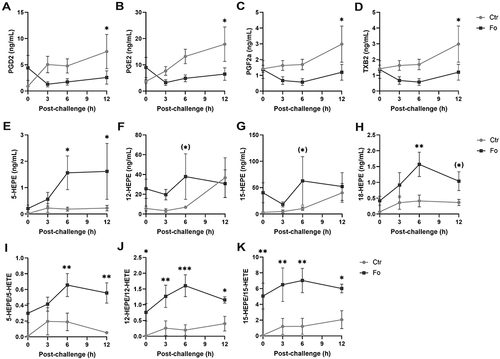
Figure 7 Dietary fish oil dampens pro-inflammatory lipid mediator concentrations, increases anti-inflammatory HEPEs concentrations and increases the ratio of HEPEs to HETEs. Mice were fed control (Ctr, grey line with grey circles) or fish oil (Fo, black line with black squares) diets for 5 weeks. They were immunized twice with mBSA with a 2-week interval and subsequently challenged intraperitoneally. Mice were sacrificed at 0, 3, 6, and 12 h following challenge and peritoneal lavage collected. Peritoneal concentrations of PGD2 (A), PGE2 (B), PGF2α, (C), TXB2 (D), 5-HEPE (E), 12-HEPE (F), 15-HEPE (G), 18-HEPE (H) and 5-HETE, 12-HETE, and 15-HETE were determined by tandem LC-MS/MS and 5-HEPE/5-HETE (I), 12-HEPE/12-HETE (J), and 15-HEPE/15-HETE (K) calculated for each mouse at the indicated timepoints. (*)p < 0.1, *p < 0.05, **p < 0.01, ***p < 0.001; n = 6 for all time-points. Results are shown as mean ± standard error of the mean from data collected from at least two independent experiments.