Figures & data
Table 1 Demographical and Clinical Features of Included Subjects
Figure 1 Lower respiratory tract microbiome alpha and beta diversity of taxonomic analysis. (A) Comparison of the ACE index based on the genus profile in different groups for assessment of microbiome alpha diversity of three groups. * P≤0.05. (B) Comparison of the Shannon index based on the genus profile in different groups. (C) Beta diversity was assessed by PERMANOVA based on Bray-Curtis distances using principal coordinate analysis (PCoA). (D) Beta diversity was assessed by ANOSIM based on Bray-Curtis distances using non-metric multidimensional scaling (NMDS). (E) PERMANOVA index of groups. (F) ANOISM index of groups.
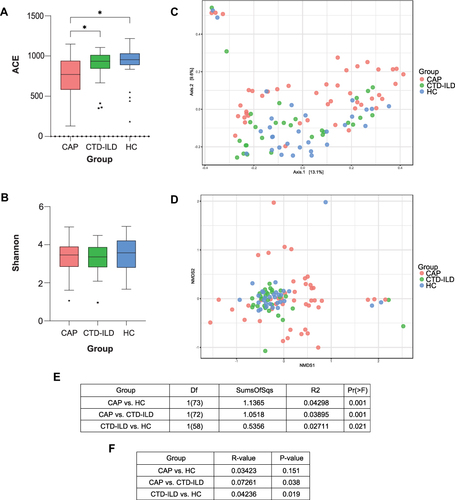
Figure 2 Taxonomic analysis of the lower respiratory tract microbiome. (A) The relative abundance of microbial communities at the phylum level among groups. (B) Spearman’s rho calculated between ASVs and clinical indicators. (C) Linear discriminant analysis of effect size (LEfSe) of ASVs enriched in each group. Enrichment in different groups indicated by the colored bar along the left of the heatmap. Black stars within heatmap boxes indicate significant results (* P≤0.05, ** P≤0.01), Benjamini–Hochberg adjustment for multiple comparisons. ASV abundances were centered with log-ratio transformation prior to analysis.
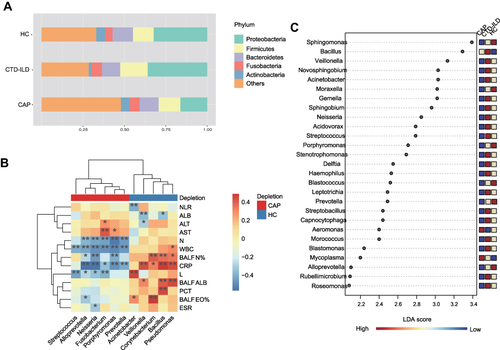
Figure 3 Metabolic and lipidomic profiles of CAP patients and controls. (A) A principal component analysis (PCA) score plot of metabolic and lipidomic profiles in BALF samples. PCA score plot colored according to sample group: red circles, severe CAP (SCAP); blue triangles, healthy control (HC); green squares, CTD-ILD. (B) Venn plot to identify the differential metabolites associated with CAP and CTD-ILD patients (P ≤ 0.05, and VIP > 1). (C) Correlation analysis among metabolites and relationships with inflammatory mediators. The green lines represent positive correlations and the Orange lines represent negative correlations. WBC white blood cell, N neutrophil, CRP C-reactive protein, ESR Erythrocyte Sedimentation Rate, BALF_N% the percentage of polymorphonuclear leukocyte in bronchoalveolar lavage, BALF_L% the percentage of lymphocyte in bronchoalveolar lavage, BALF_EO%, the percentage of eosinophil in bronchoalveolar lavage.
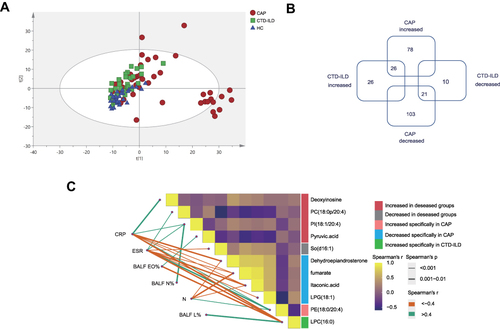
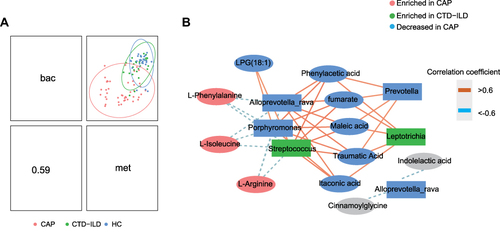
Figure 4 Integration of respiratory microbiomes and metabolomes. (A) Integration of microbiome and metabolome datasets using DIABLO software. DIABLO sample plot demonstrating the overall correlation between microbiome and metabolome data. (B) DIABLO sample plot demonstrating the microbiome-metabolome network. A positive correlation between nodes is indicated by Orange connecting lines, and a negative correlation is indicated by blue. Species and metabolites enriched in CAP and CTD-ILD are denoted by red and green, respectively. Microbiome data filtered for genomes with a minimum of 0.05% relative abundance in ≥2 samples. Microbiome data are centered log-ratio-transformed relative abundance. Metabolomics data are log-transformed auto-scaled values.