Figures & data
Table 1 Clinical Information for OSCC Patients in TCGA Database and Microarrays
Figure 1 The survival rates of oral squamous cell carcinoma (OSCC) patients grouped by CD4+ central memory T cell abundance. The OSCC patients in TCGA cohort were divided into groups with high and low score according to the median abundance of CD4+ central memory T cells. The Kaplan–Meier analysis was used to compare the survival rates of OSCC patients with high and low CD4+ central memory T cell abundance, which was tested by log-rank method.
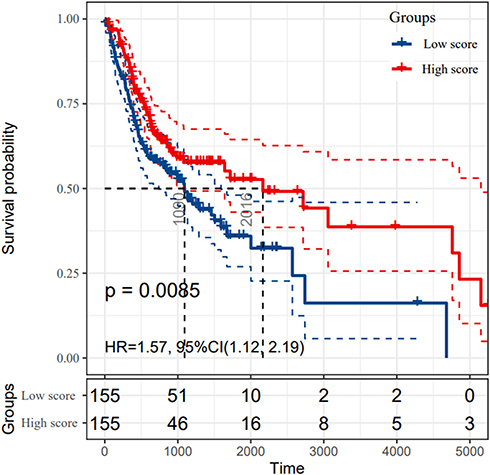
Figure 2 Establishment of predictive nomogram for oral squamous cell carcinoma (OSCC) patients based on age, gender, T sage, N stage, grade and CD4+ central memory T cell abundance in TCGA cohort. (A) Predictive nomogram. Calibration plot of the nomogram with 1-year (B), 3-year (C), and 5-year (D) overall survival of OSCC patients.
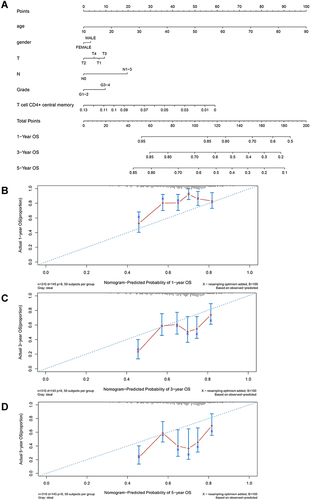
Figure 3 The survival rates of oral squamous cell carcinoma (OSCC) patients grouped by scores calculated by predictive nomogram. The overall survival of all OSCC patients (A), OSCC patients with age < 60 years old (B), age ≥ 60 years old (C), T1-2 stage (D), T3-4 stage (E), negative nodes metastasis (F), positive metastasis (G), well/moderate differentiation (H) and poor differentiation (I). The Kaplan–Meier method was used and p value was calculated by Log rank test.
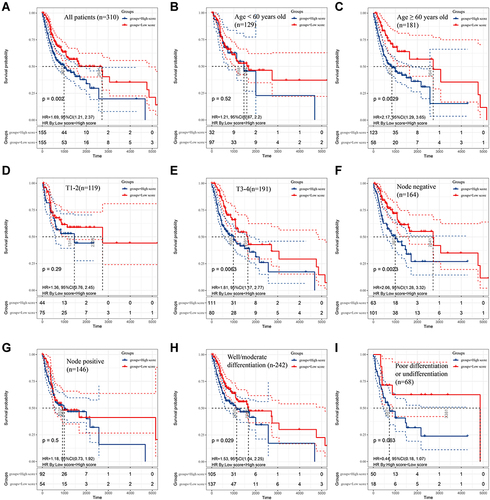
Figure 4 Identification of differentially expressed genes (DEGs) that related with CD4+ central memory T cell and functional enrichment analysis. (A) The volcano plot of DEGs between oral squamous cell carcinoma (OSCC) groups with high and low CD4+ central memory T cell abundance. (B)Gene Ontology (GO) enrichment analysis of DEGs related with CD4+ central memory T cell. MF, molecular function; CC, cell component; BP, biological process. (C) Enriched Kyoto Encyclopedia of Genes and Genomes (KEGG) pathways of DEGs related with CD4+ central memory T cell. (D) Venn diagram of the overlapped genes between DEGs related with CD4+ central memory T cell and prognostic genes in OSCC patients. (E) Cluster analysis for prognostic DEGs related with CD4+ central memory T cell OSCC patients from the TCGA cohort. (F) The survival rate of OSCC patients in the TCGA cohort with high and low DEFB1 expression.
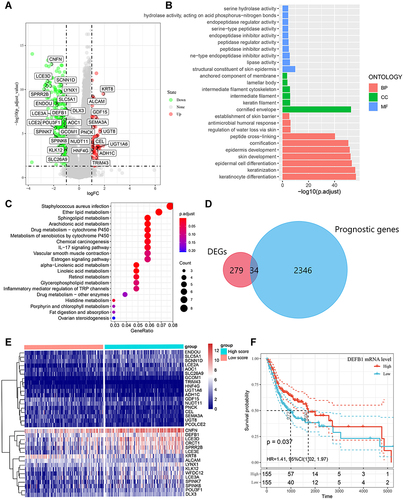
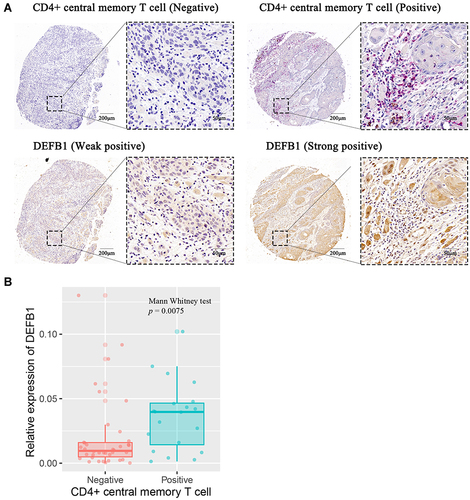
Figure 5 The correlation between protein expression level of DEFB1 and infiltrating CD4+ central memory T cells in oral squamous cell carcinoma (OSCC) tissues. (A) Representative images of both high/low expression of DEFB1 and CD4+ central memory T cell at the same location in OSCC tissues. CD4+ central memory T cell was marked with both CD45RO+ (red) and CCR7+ (brown). (B) The correlation between DEFB1 expression and CD4+ central memory T cell infiltration in OSCC tissues. p value was calculated by Mann–Whitney test.