Figures & data
Figure 1 LPS promoted UCHL1 expression in Macrophage. (A) Heat map showing changes in expression of UCH family from RNA sequencing analyses of WT BMDMs unstimulated or stimulated with LPS (100ng/mL) for 6h. (B) UCHL1 mRNA and protein expression were assessed using qPCR analysis and Western blot in WT BMDMs stimulated with LPS (100ng/mL) for indicated time. Data shown are the mean ± SD. Data are summary of three independent experiments.
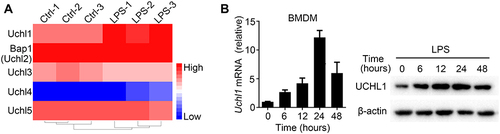
Figure 2 UCHL1 deficiency in macrophage inhibited M1 polarization in vivo. (A–C) WT and Uchl1−/− mice were stimulated with LPS (2ug/kg) for indicated times. (A) Representative expression of CD80, CD86 and CD206 from Peritoneal macrophages after 48 hours. (B) TNF-a, IL6, iNOS, Arg1, Ym1 and Fizz1 mRNA expression from Peritoneal macrophages after 48 hours stimulation were assessed using qPCR analysis (C) TNF-α, IL-6 and IL-10 secretion in the serums was measured by ELISA after 48 hours. (D) Survival curve of WT and Uchl1−/− mice (6 weeks) stimulated with LPS (10ug/kg) for indicated times. Data shown are the mean ± SD. * P < 0.05, ** P < 0.01, *** P < 0.001. Values in (A–C) were compared using Student’s t-test. Data are summary of three independent experiments.
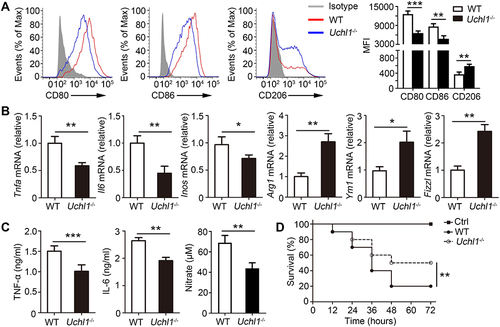
Figure 3 UCHL1 deficiency in macrophage inhibited M1 polarization in vitro. BMDMs from WT and Uchl1−/− mice were stimulated with LPS (100ng/mL) plus IFN-γ (10ng/mL) for indicated times. (A) Representative expression of CD80, CD86 and CD206 from BMDMs after 48 hours. (B) TNF-a, IL-6, iNOS and IL-10 mRNA expression from BMDMs were assessed using qPCR analysis for indicated times. (C) TNF-α, IL-6, and IL-10 secretion in the supernatant were measured by ELISA after 24 hours, and concentrations of nitrate were measured by nitrate reductase assay. Data shown are the mean ± SD. * P < 0.05, ** P < 0.01, *** P < 0.001. Values in (A–C) were compared using Student’s t-test. Data are summary of three independent experiments.
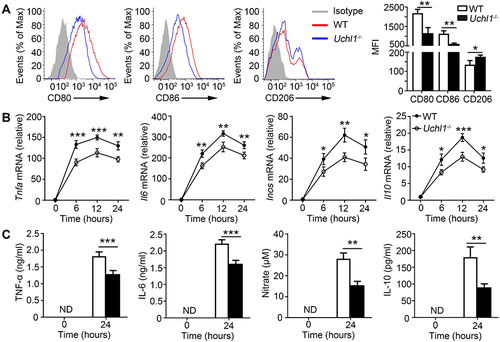
Figure 4 Overexpression of mouse UCHL1 in macrophages promote M1 polarization in vitro. (A–D) BMDMs were infected with mouse UCHL1 lentivirus for 24 hour. (A) UCHL1 mRNA expression were assessed using qPCR. (B) UCHL1 protein expression were assessed using Western blot, and densitometry quantification of band intensity are presented in the right panel. (C) BMDMs were stimulated with LPS (100ng/mL) plus IFN-γ (10ng/mL) for indicated times. TNF-α, IL-6, iNOS, and IL-10 mRNA expression from BMDMs were assessed using qPCR analysis. (D) After stimulated with IL-4 (10 ng/mL) for 12 hours, Arg1, Ym1, Fizz1 and Mrc1 mRNA expression from BMDMs were assessed using qPCR analysis. Data shown are the mean ± SD. * P < 0.05, ** P < 0.01, *** P < 0.001. Values in (A–D) were compared using Student’s t-test. Data are summary of three independent experiments.
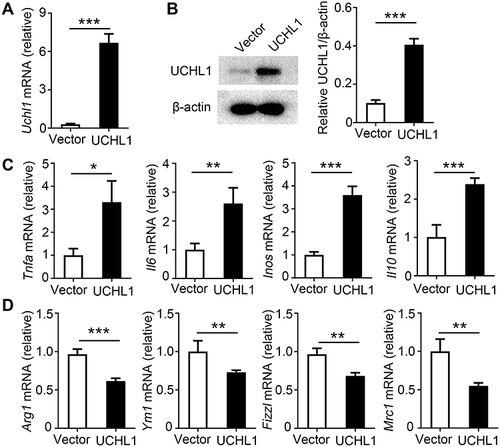
Figure 5 UCHL1 regulated AKT signaling pathway in BMDMs. WT and Uchl1−/− BMDMs were stimulated with LPS (100ng/mL) plus IFN-γ (10ng/mL) for indicated times. (A) Western blot analysis of the phosphorylation and total status of AKT, p65, p38, ERK. β-actin is as an internal control. And densitometry quantification of band intensity are presented in the right panel. (B) Western blot analysis of the phosphorylation and total status of p70s6k, 4ebp1 and mTOR. β-actin is as an internal control. And densitometry quantification of band intensity are presented in the right panel. Data shown are the mean ± SD. ** P < 0.01, *** P < 0.001. Values in (A and B) were compared using two-way ANOVA with Bonferroni’s test. Data are representative of three independent experiments with similar results.
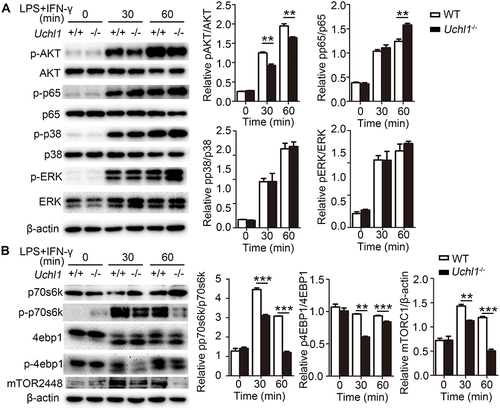
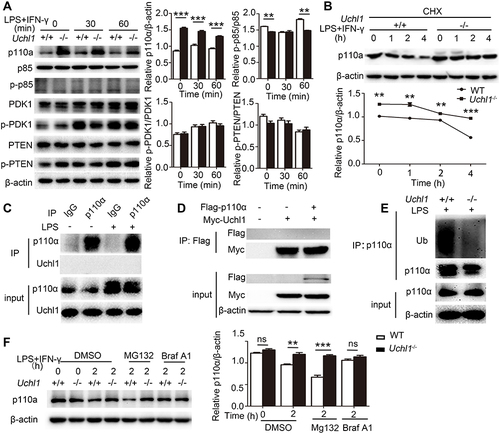
Figure 6 UCHL1 promoted the degradation of p110α through autophagy-dependent degradation pathways. (A) Western blot analysis of the phosphorylation or total status of p110, p85, PDK1 and PTEN in WT or Uchl1−/− BMDMs after stimulated with LPS (100ng/mL) plus IFN-γ (10ng/mL) for indicated time. β-actin is as an internal control. And densitometry quantification of band intensity are presented in the right panel. (B) Western blot analysis of p110 and β-actin in WT and Uchl1−/− BMDMs stimulated with LPS (100ng/mL) plus IFN-γ (10ng/mL) for indicated time in the presence of cycloheximide (CHX, 100 μg/mL). And densitometry quantification of band intensity are presented in the below panel. (C) Extracts of BMDMs unstimulated or stimulated with LPS (100 ng/mL) for 6 hours were subjected to immunoprecipitation with anti-IgG or anti-p110α beads and immunoblot analysis with anti-p110α and anti-UCHL1. Input, immunoblot analysis of whole-cell lysates without immunoprecipitation (throughout). (D) 293T cells were transfected with vectors for Myc-UCHL1 and Flag-p110α, then immunoprecipitation (IP) with anti-Flag beads and immunoblot analysis with anti-Flag and anti-Myc. Input, immunoblot analysis of whole-cell lysates without immunoprecipitation (throughout). (E) Extracts of WT and KO BMDMs treated with Mg132 after stimulated with LPS (100 ng/mL) for 6 hours were subjected to immunoprecipitation with anti-p110α beads and immunoblot analysis with anti-p110α and anti-Ubiquitin (Ub). Input, immunoblot analysis of whole-cell lysates without immunoprecipitation (throughout). (F) Western blot analysis of p110 and β-actin in WT and KO BMDMs stimulated with LPS (100ng/mL) plus IFN-γ (10ng/mL) for indicated time in the presence of DMSO or MG132 (20 μg/mL) or bafilomycin-A1 (BafA1, 50 nM). And densitometry quantification of band intensity are presented in the below panel. Data shown are the mean ± SD. ** P < 0.01, *** P < 0.001. Values in (A and B) were compared using two-way ANOVA with Bonferroni’s test, and using Student's t-test in (F). Data are representative of three independent experiments with similar results.