Figures & data
Figure 1 Continue.
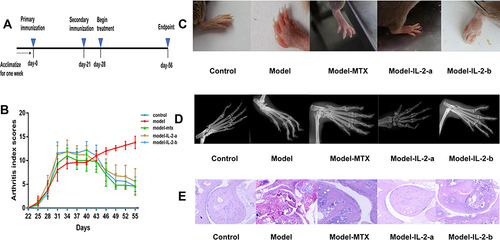
Figure 1 Low-dose interleukin-2 ameliorated collagen-induced arthritis in mice. (A) Workflow for the treatment of collagen-induced arthritis in mice. The mice were primarily immunized by injecting (s.c.) an emulsion containing CII and CFA on day 0; they were secondarily immunized with an emulsion containing CII and IFA on day 21. Mice were treated with the drug from day 28 to day 56. (Group I - Controls [non-induced + normal saline]; Group II - Model [treated with type II collagen (CII) for induction of RA + normal saline]; Group III - Model + MTX (0.25 mg/kg oral gavage feeding once per week after arthritis induction; Ld-IL-2 was administered in two doses (IL-2-a and IL-2-b); Group IV - Model + IL-2-a [IL-2: 600,000 IU/kg intraperitoneal (i.p.) injection on alternate days for 28 days after arthritis induction]; Group V - Model + IL-2-b [IL-2: 1,200,000 IU/kg i.p.on alternate days for 28 days after arthritis induction]). (B) Arthritis index scores from day 22 to day 56. Mice treated with MTX and IL-2 showed significantly lower AI scores than did the model group. (C) Representative images of paws from each group on day 56. (D) Radiographs of paws from each group on day 56. (E) Histological analysis of hind paw sections from each group, stained with hematoxylin and eosin (H&E), and assessed via light microscopy. (F) The concentrations of IL-2, IL-6, IL-17, IL-10, IL-21 and TNF-α in serum samples from each group at day 56 were evaluated using ELISA. Data are representative of three or more samples. Independent experiments with ≥4 mice per group. Data are the mean ± SEM. a. p<0.05 compared to control, b. p<0.05 compared to model.
![Figure 1 Low-dose interleukin-2 ameliorated collagen-induced arthritis in mice. (A) Workflow for the treatment of collagen-induced arthritis in mice. The mice were primarily immunized by injecting (s.c.) an emulsion containing CII and CFA on day 0; they were secondarily immunized with an emulsion containing CII and IFA on day 21. Mice were treated with the drug from day 28 to day 56. (Group I - Controls [non-induced + normal saline]; Group II - Model [treated with type II collagen (CII) for induction of RA + normal saline]; Group III - Model + MTX (0.25 mg/kg oral gavage feeding once per week after arthritis induction; Ld-IL-2 was administered in two doses (IL-2-a and IL-2-b); Group IV - Model + IL-2-a [IL-2: 600,000 IU/kg intraperitoneal (i.p.) injection on alternate days for 28 days after arthritis induction]; Group V - Model + IL-2-b [IL-2: 1,200,000 IU/kg i.p.on alternate days for 28 days after arthritis induction]). (B) Arthritis index scores from day 22 to day 56. Mice treated with MTX and IL-2 showed significantly lower AI scores than did the model group. (C) Representative images of paws from each group on day 56. (D) Radiographs of paws from each group on day 56. (E) Histological analysis of hind paw sections from each group, stained with hematoxylin and eosin (H&E), and assessed via light microscopy. (F) The concentrations of IL-2, IL-6, IL-17, IL-10, IL-21 and TNF-α in serum samples from each group at day 56 were evaluated using ELISA. Data are representative of three or more samples. Independent experiments with ≥4 mice per group. Data are the mean ± SEM. a. p<0.05 compared to control, b. p<0.05 compared to model.](/cms/asset/a99e273e-ec9e-4b60-93b0-52e25b0d3327/djir_a_344393_f0001b_c.jpg)
Figure 2 Effects of ld-IL-2 on gut microbiota in CIA mice. (A) Chao1 calculates the microbiota richness. Microbiota richness in the model group was significantly decreased (*p < 0.05). No significant differences were found among the MTX, IL-2-a, and IL-2-b groups. (B and C) Shannon and Simpson evaluate microbiota diversity. There were significant differences in microbial diversity between the model group and the MTX, IL-2-a, and IL-2-b groups. (*P < 0.05 and **P < 0.01, respectively). (D) Beta diversity heatmap. The color in the heatmap represents the difference coefficient between samples; colors closer to Orange indicate larger differences, while colors closer to green indicate smaller differences. From top to bottom, the heat maps represent Bray-Curtis, weighted UniFrac, and unweighted UniFrac, respectively. The model group exhibited a more Orange color, indicating a considerable difference from the other groups. There were no significant differences in microbiome composition among the MTX, IL-2-a, IL-2-b, and control groups. (E) Bray-Curtis-PCoA-3D. The distance between points indicates the degree of difference between samples. A smaller distance between two points indicates greater microbial community structure similarity between the two samples.
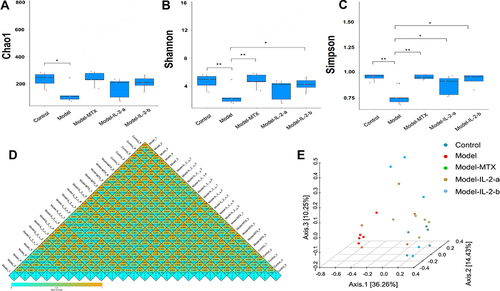
Figure 3 Ld-IL-2 treatment altered gut microbiota composition. (A) Relative abundances of gut microbiota at the phylum level. After ld-IL-2 treatment, the abundances of Firmicutes decreased (72% and 63% in the IL-2-a and IL-2-b groups, respectively), while the abundances of Bacteroidetes increased (23% and 34% in the IL-2-a and IL-2-b groups, respectively). (B) At the genus level, the Lactobacillus abundances decreased after ld-IL-2 treatment (46% and 31% in the IL-2-a and IL-2-b groups, respectively). (C) Distribution histograms of LEfSe analysis (LDA scores > 4). Each transverse cylinder represents a species; the length of the cylinder corresponds to the LDA value. A higher LDA value indicates a greater difference. The control group had the most obvious altered OTUs. In the model group, five OTUs showed significant differences. The eight most obviously altered OTUs were in the MTX group. There were one and two altered OTUs in the IL-2-a and IL-2-b groups, respectively. (D) Taxonomic cladogram of LEfSe analysis. The diagram shows different taxonomic levels from inside to outside; each connection represents a lineage relationship. Each circle node represents a species. A yellow node indicates no significant difference between groups. A non-yellow node indicates that the species is the characteristic microorganism of the corresponding color group.
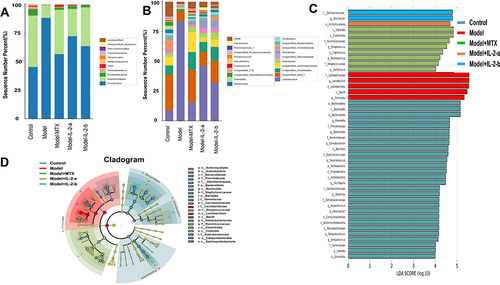
Figure 4 Ld-IL-2 may partially restore intestinal biological function. (A) Top 20 KEGG pathways for KEGG level 3. (B–E) ANOVA + Duncan analysis showed significant differences in predicted microbial community function between groups. In each channel, different colors are used to represent different groups. The letters a, b, c are arranged from high to low. Similar letters above two groups indicate a non-significant difference; different letters indicate a significant difference. For example, if one of the letters a and a, b is the same, there is no difference, and a and b are different. (B) Organismal systems. (C) Cellular processes. (D) Environmental information processing. (E) Human diseases.
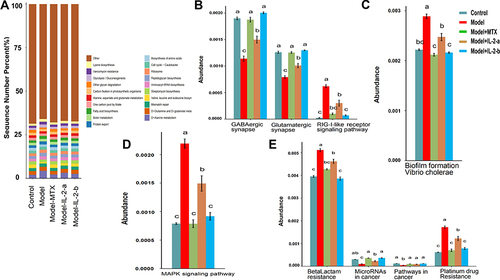
Figure 5 Ld-IL-2 treatment can improve the SCFA-related metabolic disorders caused by CIA. (A) The SCFA composition after treatment in each group was mainly acetic acid, propionic acid, and butyric acid. SCFA content was the lowest in the model group; it increased after ld-IL-2 treatment. (B–I) SCFA contents in each group after treatment. The IL-2-a group had the highest SCFA contents. There was a significant difference in isovaleric acid content among the five groups (P < 0.05). *P < 0.05, ***P < 0.001. (B) Total SCFA content. (C) Acetic acid. (D) Propionic acid. (E) Butyric acid. (F) Valeric acid. (G) Hexanoic acid. (H) Isobutyric acid. (I) Isovaleric acid.
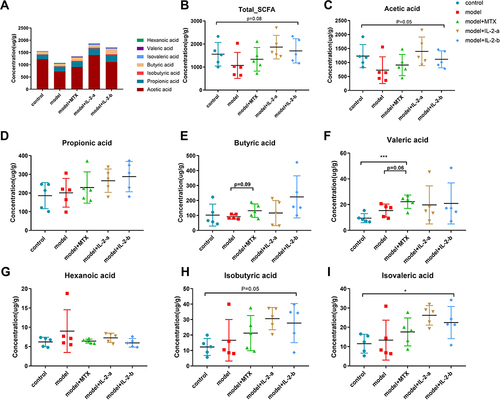
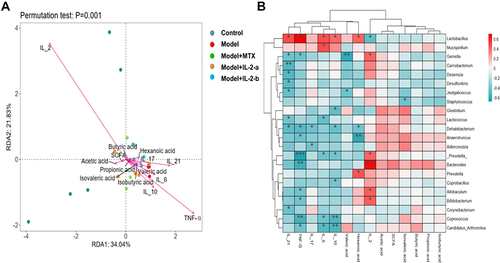
Figure 6 Correlations among gut microbiota, metabolites, and cytokines. (A) RDA of phylum level; IL-2 had the strongest correlation with the microbiota composition. SCFA: acetic, propionic, and butyric acids, along with isobutyric, isovaleric, valeric, and hexanoic acids. Cytokines: IL-2, IL-6, IL-17, IL-10, IL-21, and TNF-α. (B) Heatmap of Spearman correlation coefficients. IL-2 was positively correlated with Bacteroides abundance (P < 0.001). Positive correlations are shown using red color, while negative correlations are shown using blue color. Significance is indicated as: *P < 0.05, **P < 0.01, ***P < 0.001.