
Figures & data
Table 1 Characteristics of Patients in the Derivation Group According to the Severity of Acute Pancreatitis
Figure 1 Receiver operating characteristic curve analysis of the prediction of 28-day mortality using inflammatory biomarkers (IL-6, CPR, PCT and WBC).
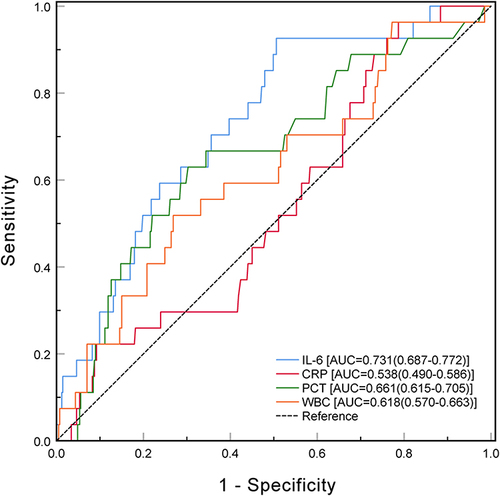
Figure 2 Receiver operating characteristic curve analysis of the prediction of 28-day mortality using thrombotic biomarkers (PT, APTT, Fib, D-dimer and PLT).
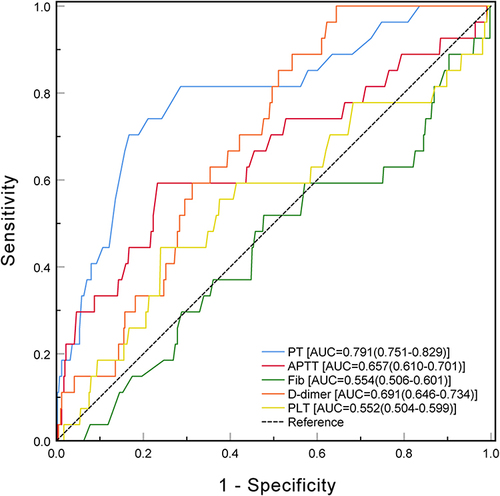
Table 2 Method for Calculating the Thrombo-Inflammatory Prognostic Score (TIPS) Using PT and IL-6 Levels
Table 3 Comparison Among Patients with Different “TIPS” Values (Derivation Group)
Figure 3 Correlation coefficient heat map of APACHE II, SOFA, BISAP and Balthazar CT scores with the TIPS. **P<0.001.
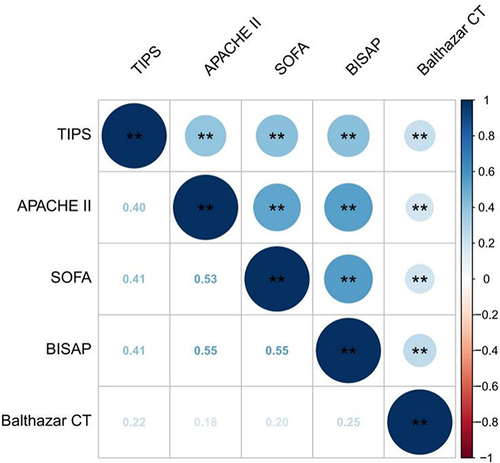
Figure 4 The 28-day mortality (A), AICU (B), MV (C), and POF (D) rates in individuals with different TIPS values. *P<0.05, ***P<0.001.
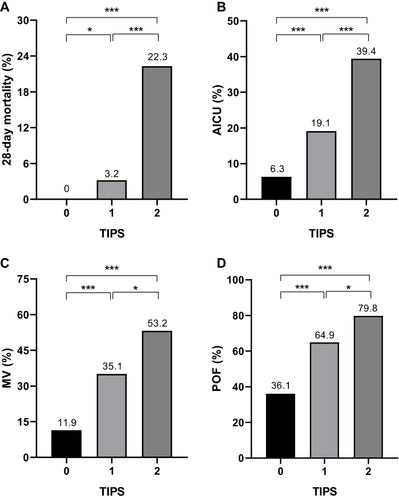
Table 4 Logistic Regression Analysis Regarding Correlations Between Clinical Outcomes and TIPS
Figure 5 AUCs of the prediction of 28-day mortality based on the TIPS, APACHE II, SOFA, BISAP and Balthazar CT scores.
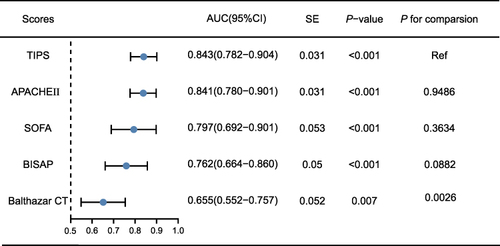
Table 5 Comparison Among Patients with Different “TIPS” Values (Validation Group, n = 358)