Figures & data
Figure 1 The schematic diagram of animal study design and infarct volumes and NE levels 3ds after MCAO stroke. (A) 8–10 weeks old male C57BL/6 mice were allocated randomly to the SHAM, M-saline, and M-CLEN groups. Mice were given intraperitoneally vehicle or CLEN respectively at 24 h and 48 h after stroke. 72 h following the stroke, mice were allocated into the indicated analyses. (B) Representative TTC-stained coronal serial sections of cortical infarcts in saline and CLEN treated MCAO mice 3 d after stroke. (C) Infarct volumes of MCAO in the saline and CLEN treated MCAO mice 3 d following the stroke (n = 6 per group). (D) Plasma NE levels were determined 3 d following the stroke in the sham-operated and saline, CLEN treated MCAO mice (SHAM n = 4, M-saline n = 5, M-CLEN n = 6). (E) Spleen levels of NE in the sham-operated and saline, CLEN treated MCAO mice 3 d following stroke (SHAM n = 5, M-saline n = 9, M-CLEN n = 6). *p < 0.05, ****p < 0.0001, one-way ANOVA with the post-hoc.
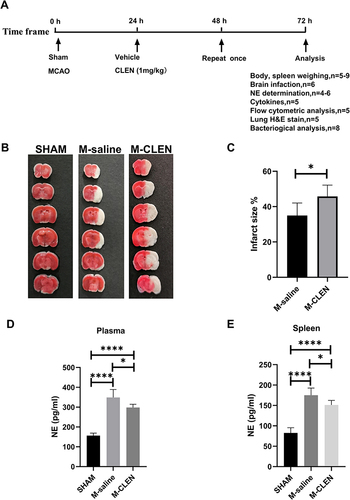
Figure 2 Body weight loss and spleen index in the sham-operated and saline, β2-ARs agonist CLEN treated MCAO mice. (A) Body weight loss was measured as an index of general stress elicited by cerebral ischemia (M-saline n = 5, M-CLEN n = 6). (B) Spleen weight and (C) Spleen index 72 h following MCAO measured as an immunosuppression index in the sham-operated and CLEN treated MCAO mice (SHAM n = 5, M-saline n = 9, M-CLEN n = 6). (D) Spleens in the above three groups were shown (SHAM n = 5, M-saline n = 4, M-CLEN n = 6). *p < 0.05, ***Indicates p < 0.001, and ****Indicates p < 0.0001 by one-way ANOVA with Holm–Sidak correction.
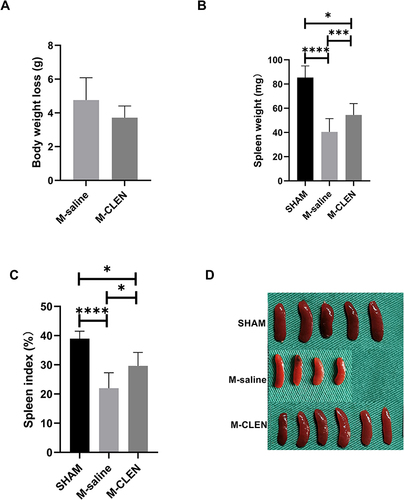
Figure 3 Adaptive cell subpopulations in the sham-operated and saline, β2-ARs agonist CLEN treated MCAO mice. (A) Percentages of CD3+ total T cells (n = 5 per group), (B) B cells (CD45R+) in the blood 72 h after stroke in the SHAM, M-saline, and M-CLEN groups (n = 5 per group). (C) Percentages of T helper cells (CD3+CD4+) and (D) Cytotoxic T cells (CD3+CD8+) in CD3+ total T cells in the blood 72 h after stroke in the SHAM, M-saline and M-CLEN groups (n = 5 per group). *p < 0.05, **Indicates p < 0.01, ***Indicates p < 0.001 and ****Indicates p < 0.0001, one-way ANOVA with Holm–Sidak correction.
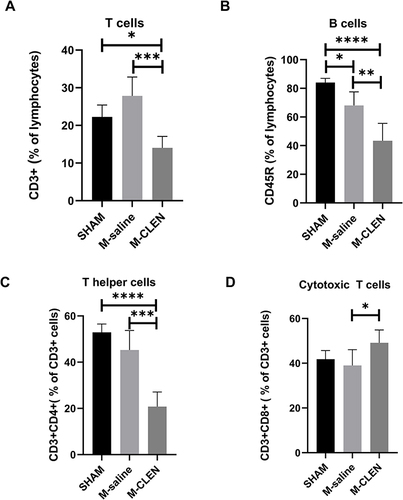
Figure 4 Innate cell subpopulations in the sham-operated and saline, β2-ARs agonist CLEN treated MCAO mice. Here shows the percentage of neutrophil, macrophage, NK cell, and dendritic cell populations in peripheral blood of sham-operated mice and mice treated with vehicle or CLEN following MCAO. (A) Neutrophils (Gr-1+) cells, (B) Macrophages (F4-80+), (C) NK cells (CD49b+), (D) Dendritic cells (CD11c+) in the blood 72 h after stroke in the SHAM, M-saline and M-CLEN groups. The sample size was n = 5 for the analysis of antigens. **p < 0.01, ***Indicates p < 0.001 and ****Indicates p < 0.0001, one-way ANOVA with Holm–Sidak correction.
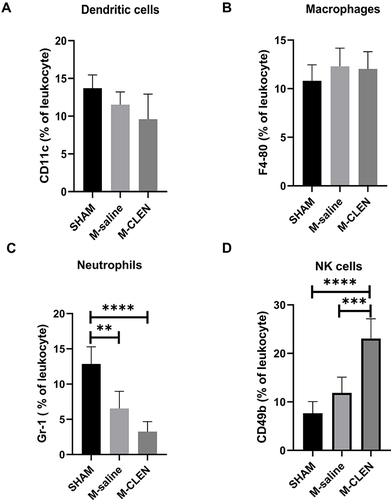
Figure 5 Effects of stroke and β2-ARs agonist CLEN application on the expression of blood cytokines in mice. (A) Pro-inflammatory cytokines TNF-α, (B) IFN-γ levels, and (C) IL-1β in sham-operated and saline, CLEN treated MCAO mice 72 h after occlusion. (D) Anti-inflammatory cytokines IL-10, (E) IL-4, and (F) TGF-β1 levels were assessed in sham-operated and saline, CLEN treated MCAO mice 72 h after occlusion. *p < 0.05, **p < 0.01, ***p < 0.001 and ****Indicates p < 0.0001 (one-way ANOVA with Holm–Sidak correction, n = 5 per group in all the analysis of cytokines).
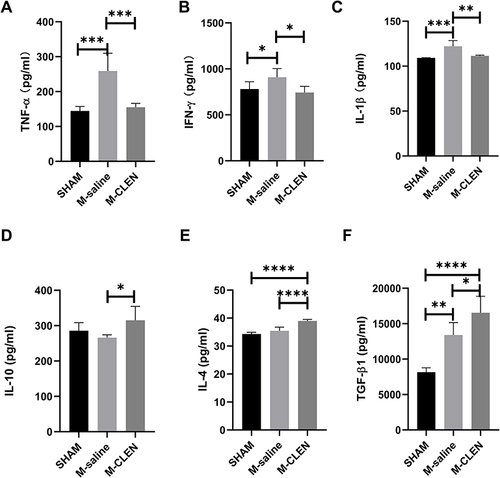
Figure 6 β2-ARs agonist CLEN inhibits or limits pneumonia in post-stroke MCAO mice. MCAO mice received the CLEN or only diluent after stroke, as described in Materials and Methods. BALF and lung samples were collected 72 h after stroke. (A) Lungs from sham-operated and CLEN or diluent-treated MCAO mice (each group n = 5) were collected after 72 h for histological examination. A representative 12-µm section of HE-stained lung from CLEN-treated MCAO revealed signs of pneumonia (thickening of alveolar walls and neutrophilic infiltrates) ×40, arrows. (B) Quantitative analysis of histopathological lung injury scores (n = 5 animals per group). Kruskal–Wallis test, **p < 0.01. (C) BALF samples from sham-operated and CLEN or diluents-treated MCAO mice (n = 8 per group) were collected for bacteriological analysis 72 h after stroke. Data are given in CFU/mL (log 10) BALF. One-way ANOVA with Holm–Sidak correction. **p < 0.01.
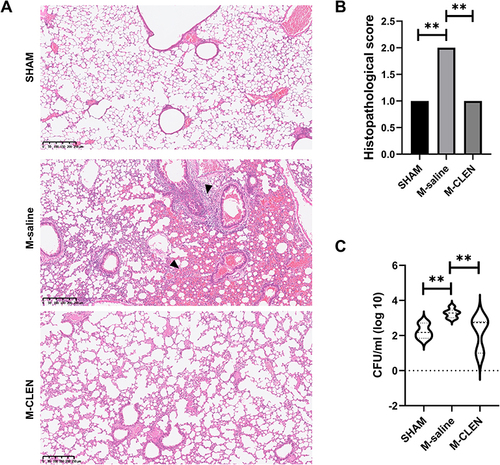
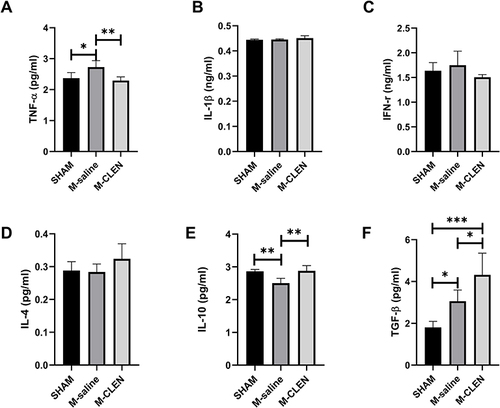
Figure 7 Effects of β2-ARs agonist CLEN on the expression of lung cytokines in MCAO mice. (A) Proinflammatory cytokines TNF-α, (B) IL-1β, and (C) IFN-γ levels in the sham-operated and saline, CLEN treated MCAO mice 72 h after occlusion. (D) Anti-inflammatory cytokines IL-4, (E) IL-10, and (F) TGF-β1 levels were assessed in the sham-operated and saline, CLEN treated MCAO mice 72 h after occlusion. *p < 0.05, **Indicates p < 0.01, ***Told p < 0.001 by one-way ANOVA with Holm–Sidak correction, n = 5 per group in all the analysis of cytokines.