Figures & data
Figure 1 Flow chart of the experimental process.
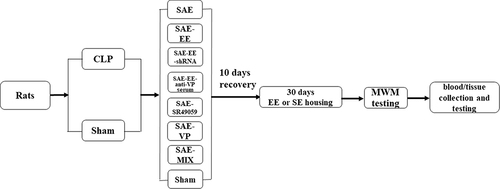
Figure 2 (A) From day 3 on, the rats with SAE had a longer latency time to the platform than the sham rats. From day 4 on, the SAE-EE rats reached the submerged platform quicker than the SAE rats. For A, Sham vs SAE: #p < 0.05, ##P < 0.01, ####P < 0.0001; SAE vs SAE-EE: ****p < 0.0001. (B) No differences were found in latency to the visible platform. (C) The SAE rats spent less time in target quadrant C compared with sham or SAE-EE rats. For C, **p < 0.01. (D) The SAE rats had fewer target crossing times when compared with the sham or SAE-EE rats. For D, *p < 0.05. (E) No differences were observed for swimming speed among the groups. The assignment of order was counterbalanced across the rats in this test. Data represent the means ± standard error of the mean.
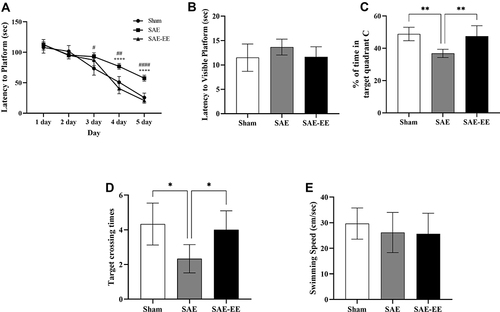
Figure 3 (A) VP staining in the SON. (B) The VP mean fluorescence intensity in the SAE rats was significantly lower than that in the sham or SAE-EE rats. (C) The amount of VP in the SON in the SAE rats was lower than that in the sham or SAE-EE rats. (D) The level of Vp mRNA in the SON was lower in the SAE rats compared with that in the sham or SAE-EE rats. (E) The plasma VP concentration in the SAE rats was lower than that in the sham or SAE-EE rats. (F) The amount of VP in the hippocampus of SAE rats was lower than that of the sham or SAE-EE rats. **p < 0.01, ***p < 0.001, ****p < 0.0001. Data represent the means ± standard error of the mean.
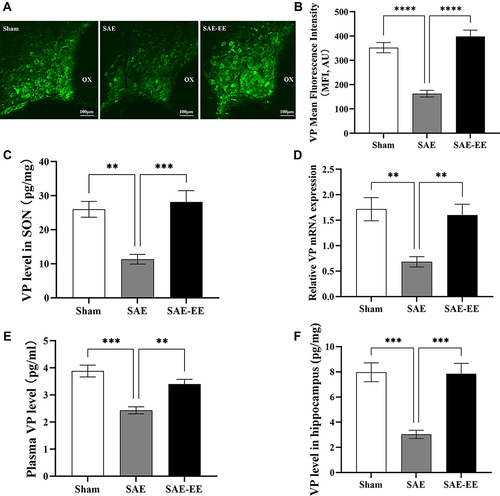
Figure 4 (A) The rats in the SAE-EE-anti-VP serum, SAE-EE-shRNA, or SAE-EE-SR49059 groups had a longer latency to platform than the rats in the SAE-EE group (from day 3 to day 5). SAE-EE vs SAE-EE-anti-VP serum: #p < 0.05, ####p < 0.0001; SAE-EE vs SAE-EE-shRNA:***p<0.001; SAE-EE vs SAE-EE-SR49059: aaaap < 0.0001. (B) The rats in the SAE-EE group spent more time in target quadrant C compared with the rats in the SAE-EE-anti-VP serum, SAE-EE-shRNA or SAE-EE-SR49059 groups. *p < 0.05,**p < 0.01. (C) The rats in the SAE-EE group had more target crossing times when compared with the rats in the SAE-EE-anti-VP serum, SAE-EE-shRNA or SAE-EE-SR49059 groups. *p < 0.05. (D) At day 5, the rats in the SAE and SAE-MIX group had a longer latency to the platform than the rats in the SAE-VP group. SAE vs SAE-VP: ***p < 0.001; SAE-VP vs SAE-MIX: #p < 0.05. (E) The rats in the SAE-VP group spent more time in target quadrant C compared with the rats in the SAE or SAE-MIX group. *p < 0.05. (F) The rats in the SAE-VP group had more target crossing times when compared with the rats in the SAE or SAE-MIX group. *p < 0.05,**p < 0.01. Data represent the means ± standard error of the mean.
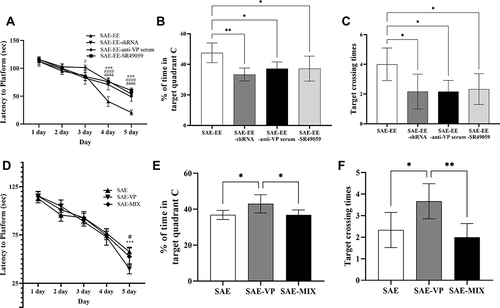
Figure 5 (A) The hippocampal IL-1β level in the SAE group was higher than that in the sham, SAE-EE group, or SAE-VP groups. No difference existed between the SAE group and SAE-MIX group. The hippocampal IL-1β level in the SAE-EE group was lower than that in the SAE-EE-anti-VP serum, SAE-EE-shRNA, or SAE-EE-SR49059 groups. (B) The hippocampal IL-6 level in the SAE group was higher than that in the Sham, SAE-EE, or SAE-VP groups. No difference existed between the SAE group and SAE-MIX group. The hippocampal IL-6 level in the SAE-EE group was lower than that in the SAE-EE-anti-VP serum, SAE-EE-shRNA, or SAE-EE-SR49059 groups. (C) The hippocampal IL-10 level in the SAE group was higher than that in the sham group, but lower than that in the SAE-EE group. No difference existed between the SAE group and SAE-MIX group. The hippocampal IL-10 level in the SAE-EE group was higher than that in the SAE-EE-anti-VP serum, SAE-EE-shRNA, or SAE-EE-SR49059 groups. (D) There was no difference of hippocampal TNF-α levels among these groups. vs SAE: *p < 0.05, ***p < 0.001,****p < 0.0001; vs SAE-EE: #p < 0.05, ##p < 0.01, ###p < 0.001,####p < 0.0001. Data represent the means ± standard error of the mean.
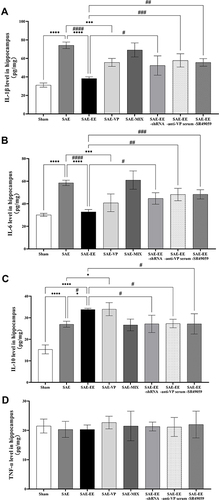
Figure 6 (A) The IL-1β level showed no differences in serum samples among the groups. (B) The IL-6 level showed no differences in serum samples among the groups. (C) The IL-10 level showed no differences in serum samples among the groups. (D) The TNF-α level showed no differences in serum samples among the groups. Data represent the means ± standard error of the mean.
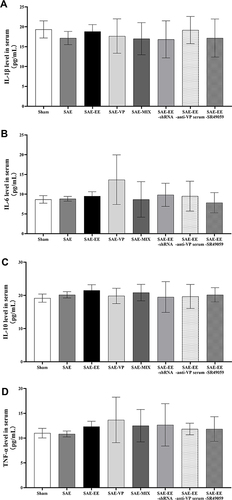
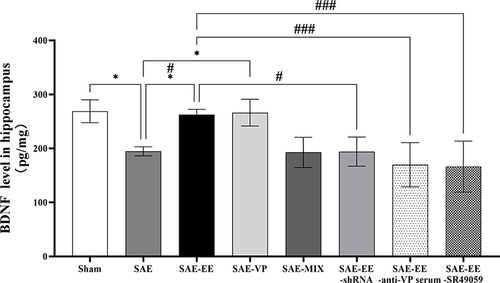
Figure 7 The hippocampal BDNF level in the SAE group was lower than that in the sham or SAE-EE group. The hippocampal BDNF level in the SAE-VP group was higher than that in the SAE group. No difference existed between the SAE group and SAE-MIX group. The hippocampal BDNF level in the SAE-EE group was higher than that in the SAE-EE-anti-VP serum, SAE-EE-shRNA, or SAE-EE-SR49059 groups. vs SAE: *p < 0.05, vs SAE: #p < 0.05, ###p <0.001. Data represent the means ± standard error of the mean.