Figures & data
Figure 1 Workflow diagram of data collection and analysis.
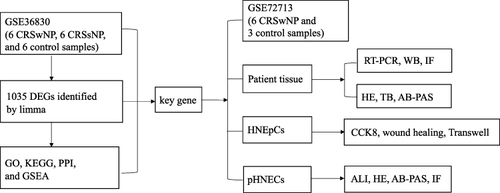
Figure 2 The results of bioinformatics analysis. (A) The top 50 DEGs identified by R software. The highly expressed genes in NP group were represented by the red areas and lowly expressed were represented by the green areas. (B) Volcano plot. Red dots represent the up-regulated genes and blue dots represent the down-regulated genes. (C) The top 10 key genes of DEGs identified by cytohubba. (D) The degree of the top 10 key genes was listed by R software. (E) GO functional enrichment result of DEGs. (F) KEGG functional enrichment result of DEGs. (G) EGF was highly enriched in “WNT-activated receptor activity” (ES=0.57, NES =1.65, p<0.05) according to GSEA. (H) The heatmap of GSEA showed genes distribution of “WNT-activated receptor activity”.
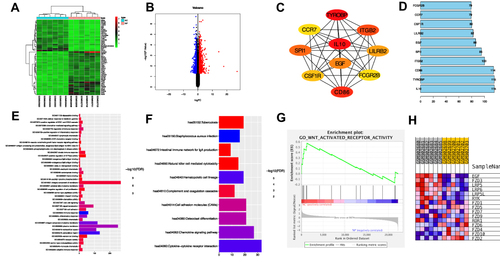
Figure 3 The expression level of EGF and the histologic appearance of nasal tissues. (A) The mRNA level of EGF were down-regulated in NP group in GSE72713. (B) The mRNA level of EGF were down-regulated in NP tissues of CRSwNP patients. (C) Western blot result of EGF in nasal tissues. (D) Densitometric analysis of EGF in nasal tissues. (E) Infiltration of eosinophils was examined using HE staining. (F) The hyperplasia of mucous cells was examined using AB-PAS staining. (G) Infiltration of mast cells was examined using immunofluorescence staining. (H) Immunofluorescence staining detect the expression of EGF in nasal tissues. (I) Immunofluorescence staining detect the expression of ZO-1 in nasal tissues. (J) Immunofluorescence staining localize the expression of EGF, P63, and Tubulin in nasal tissues. ****p < 0.0001, ***p < 0.001. (Original magnification, ×400).
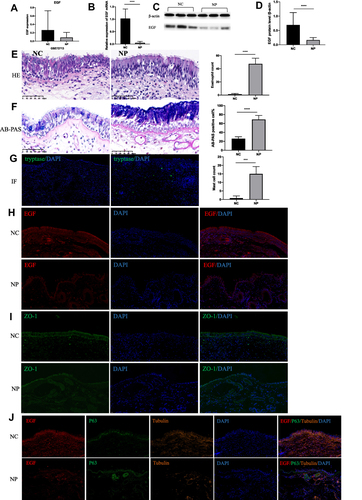
Figure 4 RhEGF promote migration and proliferation of HNEpCs. (A) Images and statistical analysis of Transwell assay. (B) Images and statistical analysis of wound healing assay. (C) Effects of rhEGF on HNEpCs proliferation. **p < 0.01, *p < 0.05.
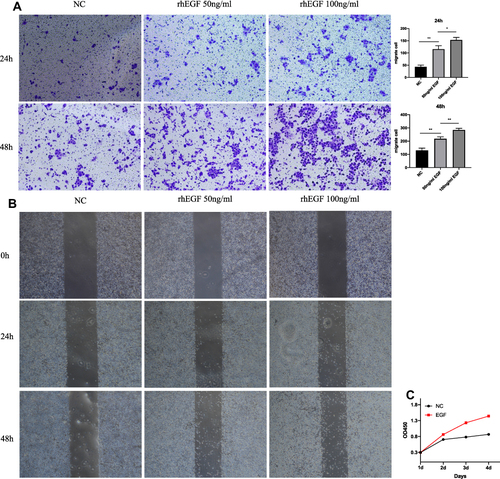
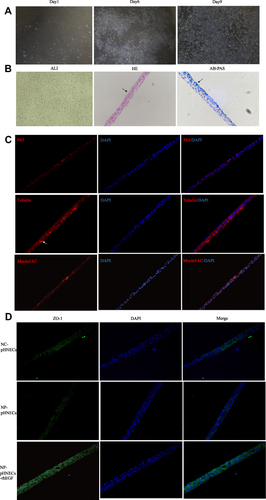
Figure 5 Identification of pHNECs and the effects of rhEGF. (A) Images of pHNECs identified with microscopy. (B) Images of pHNECs cultured in ALI (The arrow in HE shows the cilia structure; the arrow in AB-PAS shows the mucous cells). (C) Images of pHNECs cultured in ALI identified with immunofluorescence. (D) RhEGF up regulated the expression of ZO-1 in pHNECs from NP tissues. (Original magnification, ×400).