Figures & data
Table 1 Demographics and Tumor Characteristics of the Study Population
Figure 1 Ploidy distributions during liver tumorigenesis. (A) Representative immunofluorescence images in the observation set (original magnification: 400×, scale bar = 50 μm); β-catenin (green) was stained to label the plasma membrane, and DAPI (blue) for the nucleus labelling (white arrow indicates binuclear hepatocytes). Comparisons of FBP (B), and FMP (C) during hepatocarcinogenesis. Levels of significance: **p< 0.01, ***p< 0.001, ****p< 0.0001, ns, not significant (Dunn’s multiple comparisons test). (D) Discriminative capacities of FBP and FMP as the classification signal. The FMP exhibited higher AUC values than the FBP as a diagnostic maker to distinguish peritumoral liver tissues from non-HCC tissues and to detect the presence of MVI in HCC tissues.
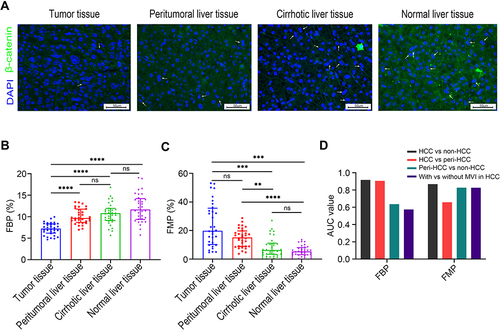
Figure 2 Association between polyploidy spectrum and posttransplant recurrence risk. (A) Recurrence-free survival curves of recipients with HMP–HCC and PMP–HCC. PMP–HCC was associated with significantly better recurrence-free survival than those with HMP–HCC. Recurrence-free survival stratified according to the ploidy distribution and with the combination of the Milan criteria (B), the AFP model (C), and the Metroticket 2.0 criteria (D). Transplant recipients exceeding these selection criteria but with PMP–HCC displayed comparable prognosis as compared to those fulfilling these criteria, while significantly better recurrence-free survival than those beyond these selection criteria but had HMP-HCC.
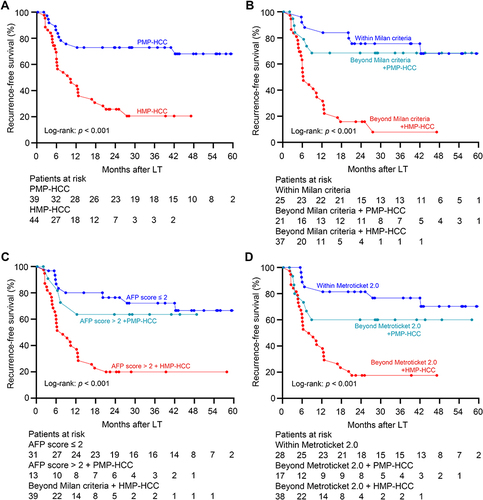
Table 2 Cox Analyses of Variables Related to the Recurrence-Free Survival
Table 3 Comparisons of Clinicopathological Features Between Patients with PMP–HCC and HMP–HCC
Figure 3 Association between ploidy status and tumor-infiltrating lymphocyte constitution. The densities of Foxp3+ Treg cells (A) and of CD8+ cytotoxic T cells (B) between HMP–HCC and PMP–HCC, and their linear correlations with the fraction of mononuclear polyploidy (Spearman’s rank-order correlation). HMP–HCC was associated with significantly higher Foxp3+ Treg cells but lower density of CD8+ cytotoxic T cells. The fraction of mononuclear polyploidy was positively correlated with the density of Foxp3+ Treg cells and negatively correlated with that of CD8+ cytotoxic T cells. Upper panel, 200× magnification, scale bar = 200 μm; lower panel, 400× magnification, scale bar = 50 μm. Comparisons of PD-L1 expression by tumoral cells (C) and the immune stroma (D) between HMP–HCC and PMP–HCC (Pearson’s chi-square test). HMP–HCC had higher frequency of PD-L1 expression by the tumor cells than PMP–HCC, whereas PD-L1 expression in the immune stroma did not differ between the two groups.
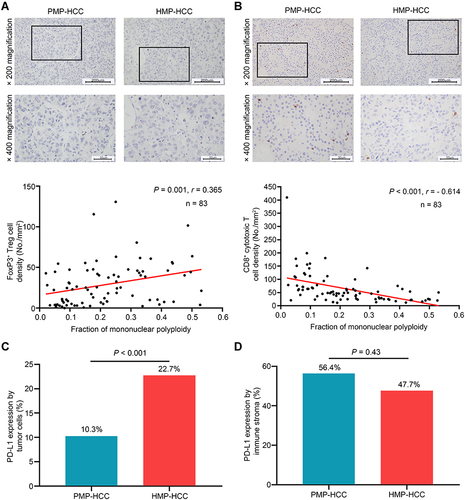
Table 4 Comparisons of Circulating Inflammatory Cytokine Concentrations Between Patients with HMP–HCC and PMP–HCC
Figure 4 Recurrence-free survival stratified according to the RAMPS score in the derivation set (A) and validation set (B). Group 1: low risk group, absence of any independent risk factors (RAMPS score of 0); Group 2: medium risk group, presence of only one risk factor (score 4–6); Group 3: high risk group, presence of two risk factors (score 9–11); Group 4: very high risk group, three or more risk factors (score 14–20). Recurrence-free survivals of recipients among the four groups were well-stratified according to the RAMPS score, and statistical results comparing survival curves between each two groups by the Log rank tests were provided in the tables.
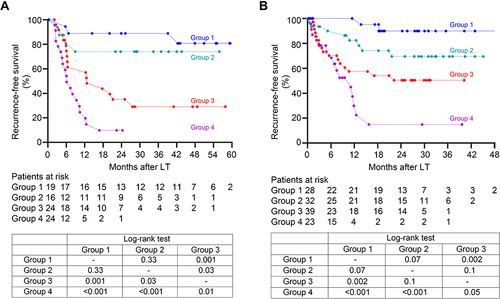
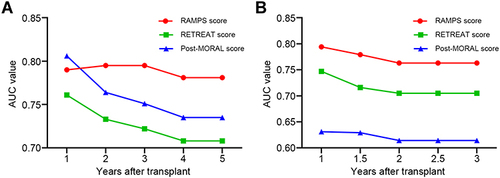
Figure 5 The time-dependent AUC values of the RAMPS score, the RETREAT score, and the post-MORAL score for recurrence prediction in the derivation (A) and validation (B) sets. In both transplant cohorts, the RAMPS score achieved the highest AUC values for the recurrence prediction when compared to the RETREAT score and post-MORAL score.