Figures & data
Table 1 A List of Primers Used for qRT-PCR Assay
Figure 1 Elevated oxidative stress and pyroptosis in the cellular PD model. (A) Outgrowth of neurites from PC12 cells treated with NGF-β. Morphological alterations of PC12 cells were observed by microscopy following NGF-β treatment for 7 d. (B) Relative TH mRNA levels in PC12 cells treated with NGF-β. Quantitative RT-PCR was performed to detect TH mRNA levels. (C) In situ expression of TH proteins in PC12 cells following NGF-β treatment. TH protein contents in PC12 cells were analyzed by immunocytochemistry. (D) Proliferation of PC12 cells treated with NGF-β and exposed to 6-OHDA (100 μM). Proliferation was assessed by MTS assay. (E) Alteration of apoptosis in PC12 cells following NGF-β induction and 6-OHDA exposure (100 μM). Apoptosis of PC12 cells was evaluated by flow cytometry. (F) Elevated ROS contents in the cellular PD model. Flow cytometry was performed to detect ROS levels in cells. (G and H) Increased IL-1β and LDH release in the cellular PD model. IL-1β (G) and LDH release (H) were detected by ELISA. (I) Alterations of α-synuclein, Nrf2, and pyroptosis marker proteins in the cellular PD model. Protein abundance in cultured PC12 cells was analyzed by Western blot. Relative protein expression was calculated based on the gray values. GAPDH was used as an internal standard. **P < 0.01.
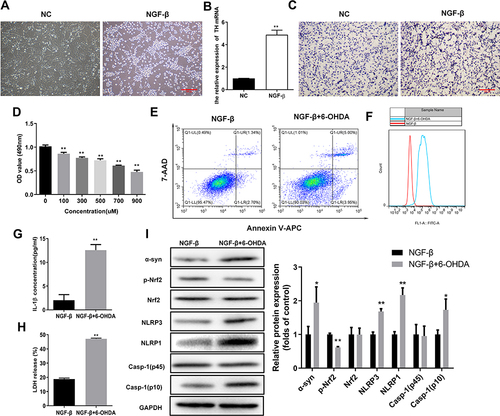
Figure 2 Oxidative stress and pyroptosis were promoted in the rat PD model. (A) Impaired muscle strength and equilibrium in rats of the PD model group. Motor dysfunctions in PD model rats were assessed by traction test scores. (B) Morphological changes in hippocampus were assessed by H&E and Nissl staining, In addition, Nissl-stained cells were evaluated in whole brain tissues of PD model rats. And the number of nerve cells was counted. (C) Increased numbers of apoptotic cells in brain tissues of the rat PD model group. TUNEL staining was used to detect cell apoptosis. (D) Changes in Nrf2 expression and subcellular locations in brain tissues of the rat PD model. Nrf2 expression and distribution were analyzed by immunofluorescence. (E) Protein abundances of PD and pyroptosis markers and phosphorylated Nrf2 in the rat PD model. Protein levels in rat tissues were quantified by Western blotting. (F) Relative protein levels of were quantified for westerns blot based on gray values. (G and H) Increased levels of IL-1β and IL-18 in serum from the PD model group. ELISA was used to determine IL-1β (F) and IL-18 (G) levels in rat serum. (I) Enhanced LDH release from rats in the PD model group. *P < 0.05; **P < 0.01.
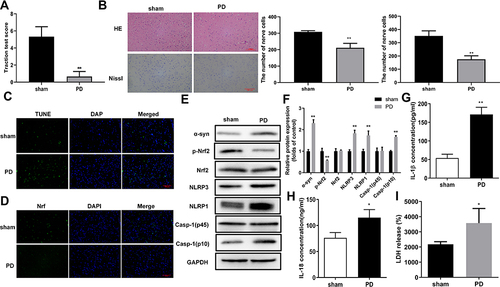
Figure 3 Nrf2 overexpression suppressed pyroptosis in the cellular PD model. (A) Proliferation rates of Nrf2-overexpressing PC12 cells exposed to 6-OHDA. Cell proliferation was assessed by MTS assay. (B) Alterations in apoptotic PC12 cells overexpressing Nrf2 following 6-OHDA exposure. Apoptosis was determined by flow cytometry. (C) Differential expression of Nrf2 and pyroptosis marker proteins in Nrf2-overexpressing PC12 cells exposed to 6-OHDA. Protein levels in PC12 cells were analyzed by Western blotting. (D) Relative protein expression was counted in Western blot. (E and F) Changes of IL-1β and LDH release in the cellular PD model with Nrf2 overexpression. Marker protein contents were detected by Western blotting. *P < 0.05; **P < 0.01.
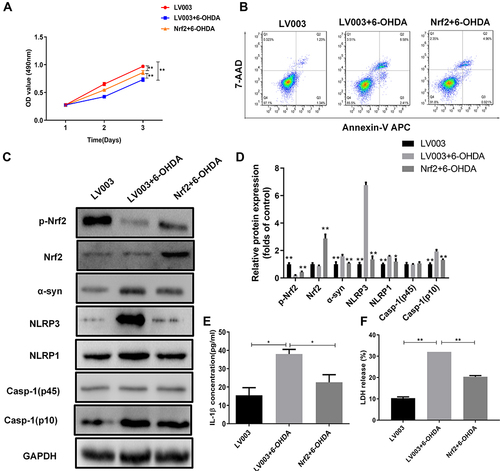
Figure 4 Nrf2 overexpression suppresses motor dysfunction and pyroptosis in the rat PD model. (A and B) Influence of Nrf2 overexpression on spatial navigation in the rat PD model. Escape latency was closely recorded to assess rat spatial navigation (B). (C) Alterations in spatial exploration capacities of the rat PD model induced by Nrf2 overexpression. Spatial exploration was evaluated by recording time spent in the target quadrant, mean speed, and platform crossover numbers. Spatial memory ability in rats was assessed using Morris Water Maze test. (D) Alterations of total travel length in the rat PD model caused by Nrf2 overexpression. The open field test was performed to assess motor dysfunction in the PD rat model. (E) Changes of Nrf2 and pyroptosis marker proteins in brain tissues of the rat PD model caused by Nrf2 overexpression. Western blotting was used to detect protein levels in rat tissues. (F) On the basis of gray values, relative protein levels were confirmed in Western blot. (G) Effects of Nrf2 overexpression on release of IL-1β, IL-18, and LDH in serum of the PD model group. IL-1β, IL-18, and LDH levels in rat serum were measured by ELISA. *P < 0.05; **P < 0.01.
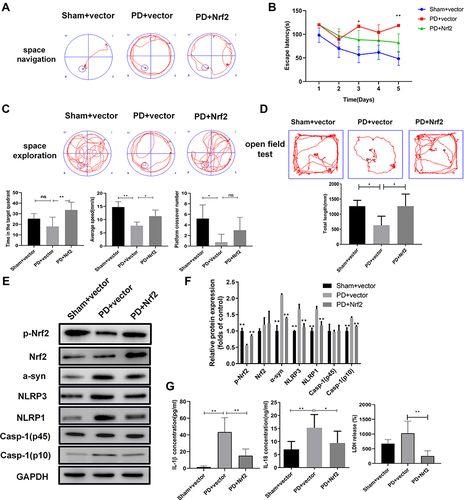
Figure 5 Nrf2 modulated lncRNA expression in the cellular PD model. (A and B) Differentially expressed lncRNAs and mRNAs in the cellular PD model with Nrf2 overexpression. Differentially expressed lncRNAs and mRNAs were characterized by deep RNA sequencing. Differences in expression of lncRNAs (A) and mRNAs (B) are presented as hierarchical clustering and scatter plots. (C) Top 20 KEGG pathways with significant enrichment of Nrf2 overexpression-induced differential mRNAs in the cellular PD model. (D and E) Proptosis-related signaling pathways with enrichment of differentially expressed mRNAs in the Nrf2-overexpressing PD model. Differentially expressed mRNAs associated with Toll-like receptor (D) and MAPK (E) signaling pathways marked in red. (F) lncRNA-microRNA-mRNA interaction network based on differentially expressed lncRNAs targeting neurotrophin, NF-κB, and Toll-like receptor signaling pathways. (G and H) Differential expressions of representative lncRNAs and microRNAs in the cellular PD model caused by Nrf2 overexpression. Expressions of lncRNAs (G) and microRNAs (H) were determined by quantitative RT-PCR. *P < 0.05; **P < 0.01.
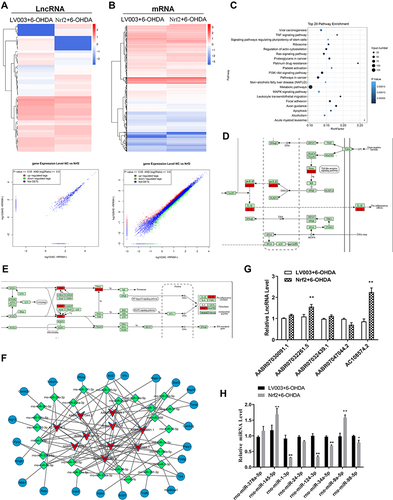
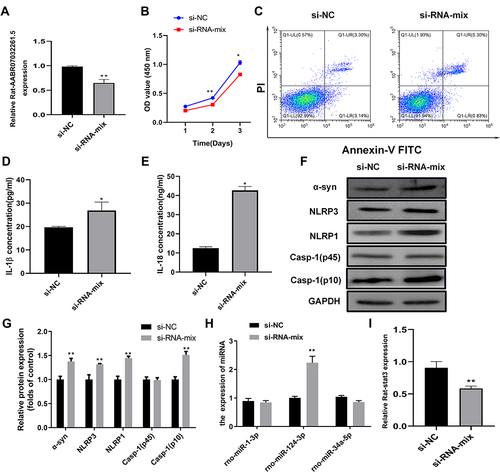
Figure 6 AABR07032261.5 silencing promotes pyroptosis in the cellular PD model. (A) Relative expression of AABR07032261.5 in the cellular PD model transfected with siRNAs targeting AABR07032261.5. lncRNA levels were analyzed by quantitative RT-PCR. (B) Effects of AABR07032261.5 silencing on proliferation in the cellular PD model. Cell proliferation was assessed by MTS assay. (C) Influence of AABR07032261.5 silencing on apoptosis in the cellular PD model. Flow cytometry was performed to detect apoptotic cells. (D and E) Altered IL-1β and IL-18 secretion in the cellular PD model with silenced AABR07032261.5 expression. IL-1β and IL-18 contents in cell cultures were measured by ELISA. (F) Differential expression of pyroptosis marker proteins in the cellular PD model caused by AABR07032261.5 knockdown. (G) On the basis of the gray values, quantitative analysis of proteins was conducted for Western blot results. (H) Differential expression of AABR07032261.5-interacting microRNAs in the cellular PD model with AABR07032261.5 knockdown. (I) Relative Stat3 mRNA levels in the cellular PD model with silenced AABR07032261.5 expression. Quantitative RT-PCR was used to detect microRNA and mRNA levels. *P < 0.05; **P < 0.01.