Figures & data
Figure 1 Airway inflammation and AHR of OVA-induced allergic asthma mice. (A) Experimental protocol. (B) Airway resistance to increased doses of Mch (mg/mL), presented as sRaw. (C) Total inflammatory cell count in BALF. (D) The mean percentage of eosinophils, lymphocytes, neutrophils and macrophages in BALF. (E) Representative HE-stained pictures of lung. (F) Inflammation scores. (G) Representative PAS-stained pictures of lung. (H) PAS-positive scores. Randomly selected three areas of each sample were used for semi-quantification. sRaw: specific airway resistance. (E and G) Magnification, ×200. Data are represented as expressed as mean ± SD (n=6). *p < 0.05, **p < 0.01, and ***p < 0.001 versus the normal control group.
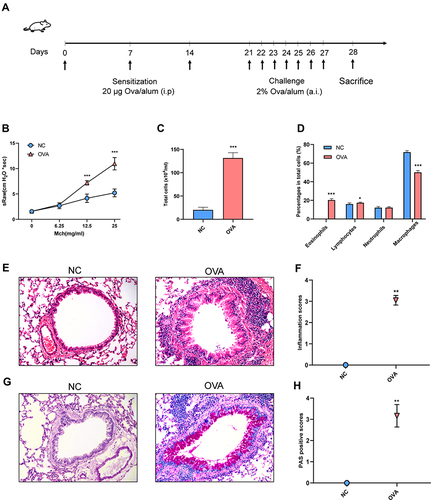
Table 1 Primer Sequences in RT-qPCR
Figure 2 Gene set enrichment analysis (GSEA) enrichment map. Abbreviation: NES, normalized enrichment score.
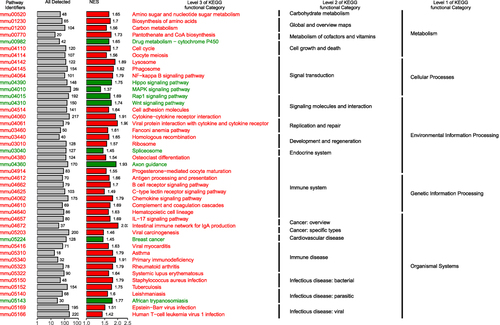
Figure 3 Hub genes of Hippo signaling pathway. (A) Network based on STRING and visualized in Cytoscape of the hub genes of the Hippo signaling pathway. (B) KEGG map of hub genes from Hippo signaling pathway rendered by Pathview.
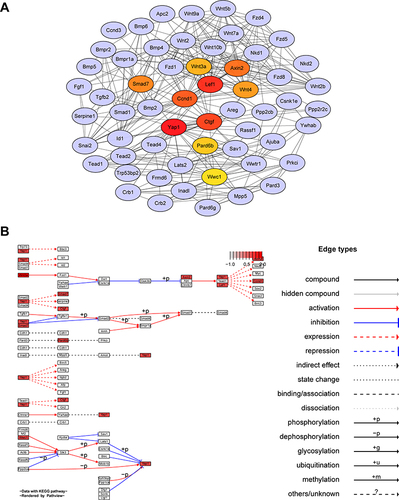
Figure 4 Macrophage proliferation is related to the downregulation of Hippo signaling pathway in OVA-induced allergic asthma mice. (A) Relationship between Hippo signaling pathway and macrophage in mice. Cellular compositions of immune microenvironment from Mouse RNA-seq data measured using the ImmuCC tool (http://218.4.234.74:3200/immune/). (B) Correlation between ssGSEA scores of the 10 hub genes as Hippo signaling pathway gene sets and the proportion of macrophage obtained from plots (A) was analyzed. (C) Correlation between RPKM values of Yap1 and the proportion of macrophage obtained from plots (A) was analyzed. (D) Correlation between RPKM values of Lef1 and the proportion of macrophage obtained from plots (A) was analyzed. (E) Correlation between RPKM values of Ctgf and the proportion of macrophage obtained from plots (A) was analyzed. (F) Relative mRNA expression of Yap1. (G) Relative mRNA expression of Lef1. (H) Relative mRNA expression of Ctgf. (I) Double-stained immunofluorescence for F4/80 and Yap1, Lef1, Ctgf in mouse lung sections 36 hours after OVA challenge respectively. (Magnification, ×200) (J) Semi-quantification of F4/80 and Yap1. (K) Semi-quantification of F4/80 and Lef1. (L) Semi-quantification of F4/80 and Ctgf. Randomly selected three areas of each sample were used for semi-quantification. Macrophages were identified with F4/80. Data are represented as expressed as mean ± SD (n=3). *p < 0.05, **p < 0.01 and ***p < 0.001 versus the normal control group. Control 1, Control 2 and Control 3: three from normal control mice were selected for lung tissue mRNA sequencing analysis. Asthma 1, Asthma 2 and Asthma 3: three from normal control mice were selected for lung tissue mRNA sequencing analysis.
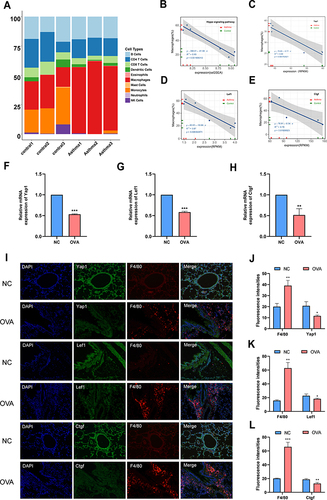
Figure 5 Validation of downregulation of the Hippo signaling pathway in endobronchial biopsies from asthma patients with GEO datasets. (A) Enrichment plots of Hippo signaling pathway; enriched in the GSE143303. (B) Enrichment plots of Hippo signaling pathway; enriched in the GSE147878. (C) Bubble plot shows -Log (P value) in the GSE143303. (D) Bubble plot shows -Log (P value) in the GSE147878.
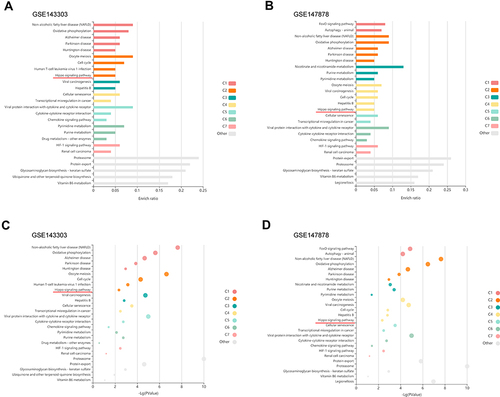
Figure 6 Hippo signaling pathway is related to the immune cell and epithelial cells identified in the human airway. (A) t-SNE displaying distribution of Ctgf in airway. (B) t-SNE displaying distribution of Ccnd1 in airway. (C) t-SNE displaying distribution of Axin2 in airway. (D) Bar plot displaying distribution of Ctgf in airway. (E) Bar plot displaying distribution of Ccnd1 in airway. (F) Bar plot displaying distribution of Axin2 in airway. (G) t-SNE displaying distribution of Wnt3a in airway epithelium. (H) Bar plot displaying distribution of Wnt3a in airway epithelium. (I) Relative mRNA expression of Wnt3a in BEAS-2B cells. (J) t-SNE displaying distribution of Pard6b in airway epithelium. (K) Bar plot displaying distribution of Pard6b in airway epithelium. (L) Relative mRNA expression of Pard6b in BEAS-2B cells. (M) t-SNE displaying distribution of Wwc1 in airway epithelium. (N). Bar plot displaying distribution of Wwc1 in airway epithelium. (O). Relative mRNA expression of Wwc1 in BEAS-2B cells. NC: normal control group. IL-13: IL-13-stimulated group. Data are represented as expressed as mean ± SD (n=3). *p < 0.05, and ***p < 0.001 versus the normal control group.
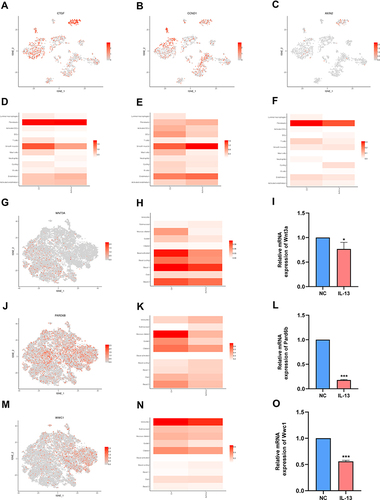
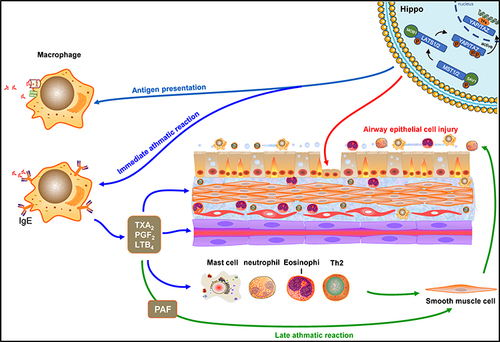
Figure 7 Diagram of the possible mechanisms between Hippo signaling pathway and macrophages of lung.