Figures & data
Table 1 Characteristics of Patients with IBD and Non-IBD Cohorts
Figure 1 The difference in serum AGR between UC patients and non-UC patients, CD patients, and non-CD patients.
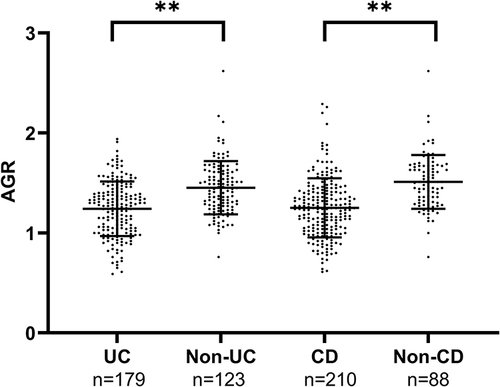
Table 2 Correlation Between BMI, Serum Biomarkers, and Disease Activity in UC Patients
Table 3 Correlation Between Serum Biomarkers and Disease Activity in CD Patients
Figure 2 The correlation between serum AGR and BMI, other inflammation markers. (A) BMI, (B) ESR level, (C) CRP level, (D) WBC level of UC patients were shown by scatter plot; the correlation between serum AGR and (E) BMI, (F) ESR level, (G) CRP level, (H) WBC level of CD patients were shown by scatter plot.
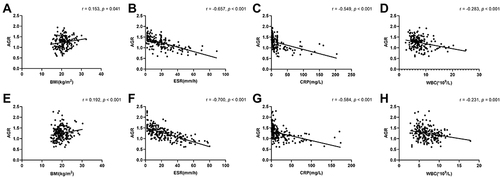
Table 4 Linear Regression Analysis of Serum AGR with Disease Activity in UC Patients
Table 5 Linear Regression Analysis of Serum AGR with Disease Activity in CD Patients
Figure 3 Distributions between serum AGR and endoscopic score in IBD patients. (A) Mayo endoscopic score in UC patients (0 or 1, n = 43; 2 or 3, n = 136), (B) SES-CD score in CD patients (0 or 1, n = 84; 2 or 3, n = 126). AGR was shown by binary ordered endoscopic disease activity, using a composite IBD endoscopy score (0 or 1 indicating inactive or mild disease and 2 or 3 indicating moderate or severe disease, respectively).
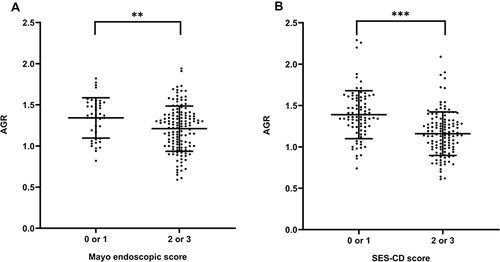
Figure 4 Correlation between serum AGR and Mayo score in UC patients (A), HBI score in CD patients (B) by using a scatter plot.
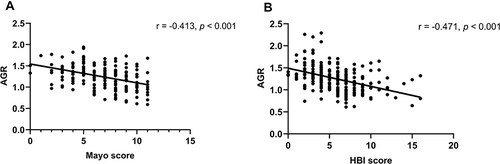
Figure 5 Receiver operator characteristic analysis of albumin to globulin ratio for distinguishing UC from non-UC (A) and CD from non-CD (B).
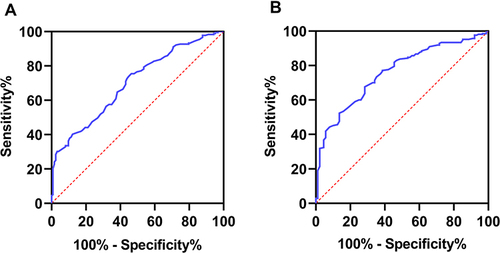
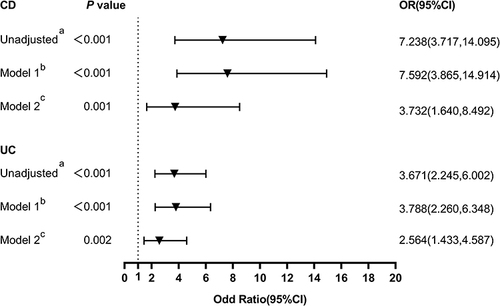
Figure 6 Multivariate adjusted odds ratios for distinguishing inflammatory bowel disease (UC and CD) from non-inflammatory bowel disease. Unadjusteda: unadjusted model. Model 1b: adjusted for age, sex. Model 2c: adjusted for covariates from Model 1 and adjusted for BMI, current smoking, ESR, CRP, WBC, Ca2+.