Figures & data
Table 1 Sample Characteristics
Table 2 Traditional Estimates of Offspring-Parent (βOP) and Full-Sib Regression Slopes (βFS) with Estimated Heritability
Figure 1 (A) Offspring-parent regression slopes (βOP) for selected quantiles of the offspring’s untransformed Lp-PLA2-mass concentrations with corresponding estimates of heritability (h2=2βOP/(1+rspouse)),11 where the correlation between spouses was rspouse=0.0525. The slopes became greater (ie, steeper) with increasing quantiles of the Lp-PLA2 distribution. (B) The selected quantile-specific regression slopes were included with those of other quantiles to create a quantile-specific heritability function. Significance of the linear, quadratic and cubic trends and the 95% confidence intervals (shaded region) were determined by 1000 bootstrap samples. (C) Quantile-specific full-sib regression slopes (βFS) with corresponding estimates of heritability as calculated by h2={(8rspouseβFS+1)0.5–1}/(2rspouse).Citation11
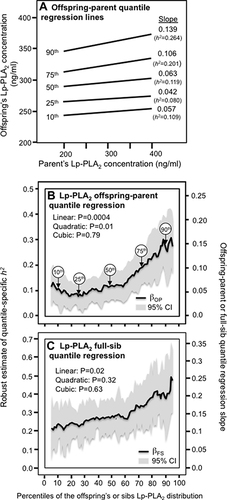
Table 3 Quantile Regression Analyses of Offspring-Parent and Full-Sib Phenotypes from the Framingham Heart Study
Figure 2 Quantile-specific heritability by percentiles of the offspring or sib phenotypic distribution for: sP-selectin concentrations (A and B); sICAM-1 concentrations (C and D); and tumor necrosis factor receptor type 2 (TNFR2) concentrations (E and F).
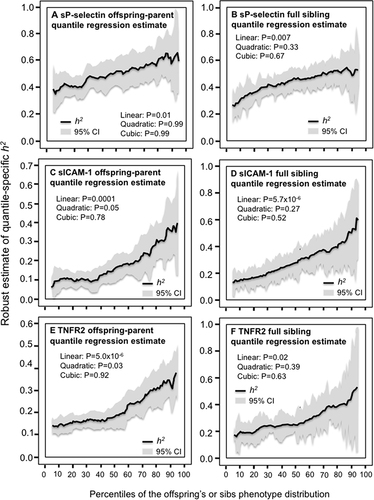
Figure 3 Quantile-specific heritability by percentiles of the sib phenotypic distribution for: (A) soluble ST2 concentrations in citrated plasma, and (B) serum osteoprotegerin concentrations.
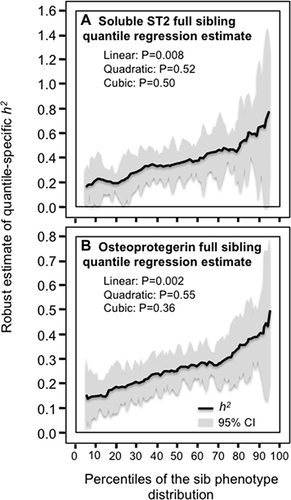
Figure 4 Precision medicine perspective of genotype-specific sP-selectin differences (histogram inserts) vs quantile-dependent expressivity perspective (line graphs showing larger genetic effect size when average sP-selectin concentrations were high) for: (A) Ay et al 2007 report on the serum sP-selectin difference between 116 venous thromboembolism (VTE) patients and 129 age and sex-matched controls by SELP rs6136 (Thr715Pro) genotypes;.Citation57 (B) Li et al 2015 report on the sP-selectin difference between congenital heart disease patients with pulmonary hypertension and healthy controls by −825T/C genotypes in the SELP promoter region; Citation44 (C) Kaur et al 2019 report on the sP-selectin difference between type 2 diabetes mellitus (T2DM) patients and healthy controls by SELP rs6136 genotypes;Citation45 (D) Di Nisio et al 2004 report on the decrease in sP-selection concentrations following 20 mg/d atorvastatin by toll-like receptor-4 (TLR-4) gene variants (Asp299Gly and Thr399Ile vs wild type);Citation46 (E) Bolewski et al 2008 report showing greater reductions in mean sP-selectin concentrations following 3 months of 20 mg/d atorvastatin treatment in 8 hypercholesterolemic patients with LDLR mutations vs 26 unmutated patients: Citation58 (F) Souza-Costa et al 2007 report on the decrease in sP-selection concentrations following 10 mg/d atorvastatin in 15 CC homozygotes and 15 TT homozygotes of the T-786C polymorphism of the endothelial nitric oxide synthase (eNOS) gene. Citation59
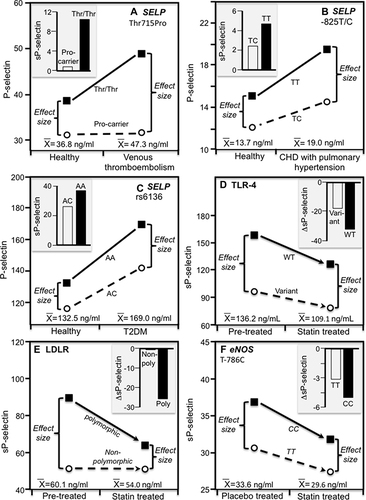
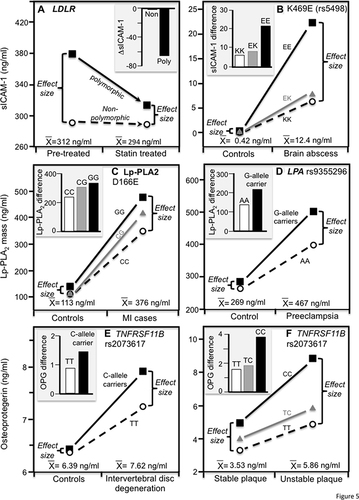
Figure 5 Precision medicine perspective of genotype-specific differences in inflammatory biomarkers (histogram inserts) vs quantile-dependent expressivity perspective (line graphs showing larger genetic effect size when average concentrations were high) for: (A) Bolewski et al 2008 report on three-month atorvastatin-induced changes in sICAM-1 concentrations in 8 patients with mutations in the low-density lipoprotein receptor (LDLR) gene vs 26 un-mutated patients;.Citation58 (B) Mishra et al 2016 report on differences in serum sICAM-1 concentrations between 100 brain abscess patients and 100 controls by ICAM-1 K469E (rs5498) genotypes;Citation60 (C) Zhang et al 2019 report on differences in serum Lp-PLA2 mass concentrations between 297 myocardial infarction (MI) patients and 262 healthy controls by Lp-PLA2 D166E genotypes; Citation51 (D) Tuten et al 2021 report on differences in serum Lp-PLA2 mass concentrations between 149 women with preeclampsia and 49 with normal pregnancies by LPA rs9355296 genotypes; Citation61 (E) Xue et al 2016 report on differences in serum osteoprotegerin concentrations between intervertebral disc degeneration patients and matched controls by TNFRSF11B 950T/C (rs2073617) genotypes;Citation52 and (F) Straface et al 2011 report on differences in serum osteoprotegerin concentrations between 74 internal carotid artery stenosis patients with unstable plaques and 95 with stable plaque by TNFRSF11B 950T/C (rs2073617) genotypes. Citation53