Figures & data
Table 1 Demographic and Clinical Characteristics in Hepatitis B Vaccine Responders and Non-Responders
Table 2 CDR3 Motif of High Expression in TRBV27 Combined with BJ1-1/J1-2/J1-4/J1-6, and BJ2-5/J2-7 in Hepatitis B Vaccine Responders Compared with Those in Non-Responders (Frequency >0.02% Shown Only)
Table 3 CDR3 Motif of High Expression in TRBV7-9 Combined with BJ2-5/J1-6/J1-2 in Hepatitis B Vaccine Responders Compared with Those in Non-Responders (Frequency >0.02% Shown Only)
Figure 1 Clonal distribution and diversity of TRBV repertoires in HepB vaccine responders and non-responders. (A) The number of unique CDR3s. (B) Ratio of counts between unique CDR3 and total CDR3s identified in HepB vaccine responders and non-responders. Data points represent the counting ratio between unique CDR3 and total CDR3 in the TR repertoire of each individual. The bars depict the mean (±SEM) of the groups when data are non-normal distribution, and the differences compared using the Mann–Whitney test. (C) The distribution of TRBV frequencies are presented through the measurement of Shannon index (diversity) and (D) clonality. Each dot represents the diversity or clonality of each subject, and bars show the mean (±SD) of the groups. The differences are compared using two-tail unpaired t-test when data are normal distribution.
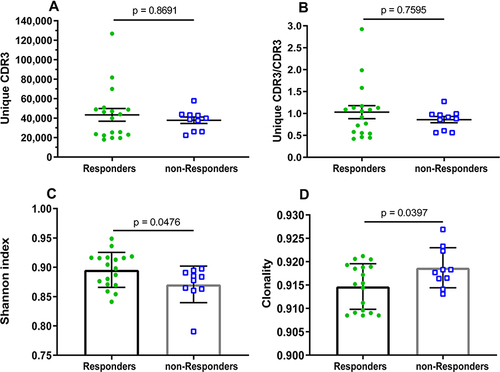
Figure 2 Comparison of the frequency, counts, and length distribution of TRB CDR3 between HepB vaccine responders and non-responders. (A) Cumulative frequency of top 100 CDR3s (CF100) in HepB vaccine responders and non-responders. Data points represent the CF100 in the total repertoire of each subject, and bars depict the mean (±SD) of the percentages of each subject. (B) The number of CDR3s with different frequency distribution range. Data are presented as Box and whiskers (5–95% percentile) of each subject, in which the middle solid line is the median count of CDR3s, the highest and lowest horizontal lines represent the 5th, and 95th percentiles. The p values of comparisons were calculated using the Mann–Whitney test, *p < 0.05. (C) Cumulative frequency of CDR3 distributions range. Data are presented as mean (±SD) of each subject using histogram. Normality of average value of cumulative frequency is detected by the Shapiro–Wilk test. (D) Comparison of the average of CDR3 length distribution between HepB vaccine responders and non-responders. Data points represent the CDR3 length average of each individual, and bars depict the mean (±SD) of subjects.
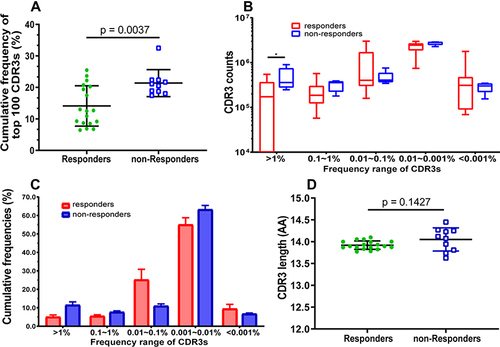
Figure 3 Distribution features of CDR3 length, TRBV, and BJ gene of the T cell clonotypes in HepB vaccine responders and non-responders. (A) The profile of CDR3 length distribution. (B) Percentage frequency of TRBV sub-families merged. The number after “*” represents the number of sub-families in this TRBV family, such as TRBV7*8 means the TRBV7 family including 8 sub-families. (C) The detail of 8 sub-families of the TRBV7. (D) Thirteen BJ families. Data show mean (± SEM) frequency of each subject. Data were compared using the Mann–Whitney test, *p < 0.05. Among all TRBV families, only the TRBV27 and BV7-9 have significantly different expression between the two groups (p = 0.0338, 0.0258), and the TRBV17, BV23-1, BV26 are low expressions or even undetectable in the most individuals.
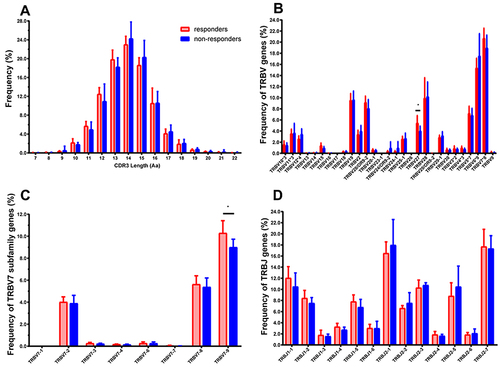
Figure 4 Profile of TRBV/BJ combination in HepB vaccine responders and non-responders. (A) Heat map of V-J gene combinations for the HepB vaccine responders, and (B) non-responders from IMGT/Stat clonotype analysis shows there are some different V-J gene combinations between the two groups. Such as, the 60 TRBV families are obviously clustered into four groups in non-responders, and the 13 TRBJ families are obviously divided into two groups, which both are not found in responders.
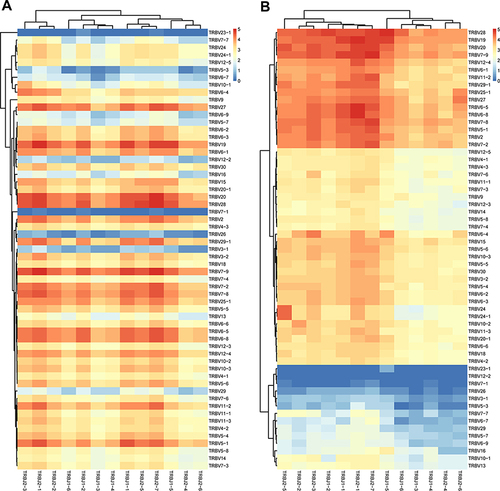
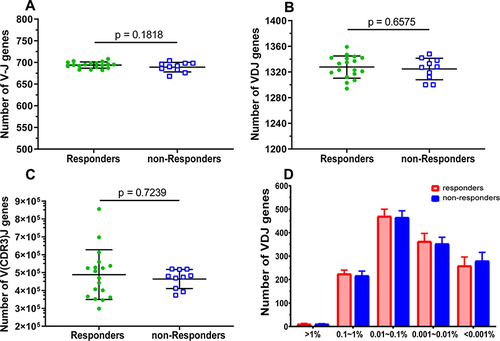
Figure 5 Comparison of the characteristics of TRBV V/D/J gene segment combinations between HepB vaccine responders and non-responders. The rearranged number of different gene segments (V/D/J) recombination of each subject for V-J genes (A), V/D/J genes (B), V(CDR3)J genes (C), and frequency distribution of V/D/J combinations (D). Each dot represents the number of each subject, and bars show the mean (±SEM). The differences are compared using the Mann–Whitney test.