Figures & data
Table 1 The Hemodynamic Parameters and Diameter of the External Jugular Vein
Figure 1 The hemodynamics, diameter, and microscopic views of EJV. (A–D) the comparisons of EJV hemodynamic parameters (E) the comparison of EJV diameter (F) the microscopic views of EJV at 0, 1, 3, and 6 weeks. **p-value < 0.01, ***p-value < 0.001. Black and white stars indicates common carotid artery and external jugular vein, respectively.
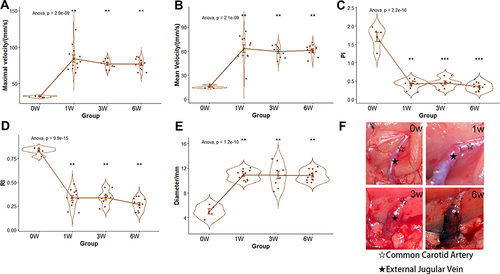
Figure 2 The identifications and GSEA analysis of DEGs between venous hypertension models and the control. (A–C) the top is the volcano of DEGs and the bottom are the heat map of the top 500 DEGs at 1, 3, and 6 weeks, respectively. (D–F) Gene set enrichment analysis (GSEA) at 1, 3, and 6 weeks, respectively.
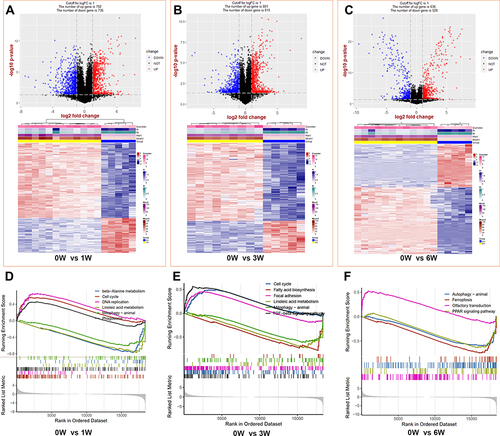
Figure 3 The change of abundance of cell types during the process of venous hypertension. (A–C) Boxplot charts of lymphoid cells, myeloid cells, and stromal cells, respectively. *p-value < 0.05, **p-value < 0.01, ***p-value < 0.001, ****p-value < 0.0001.
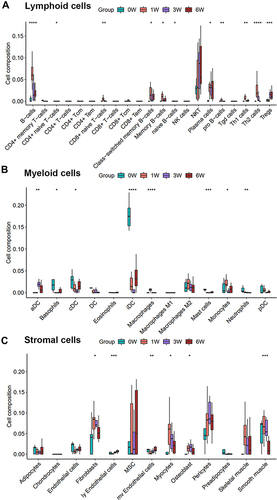
Figure 4 The identifications and the KEGG enrichments of common DEGs during the process of venous hypertension. (A) the common DEGs of up and down-regulated genes; (B) the heatmap of the common deregulated gene; (C) the KEGG enrichment analysis of up and (D) down-regulated common genes. Risk factors-the ratio of the number of genes annotated in a pathway to the number of all genes annotated in this pathway.
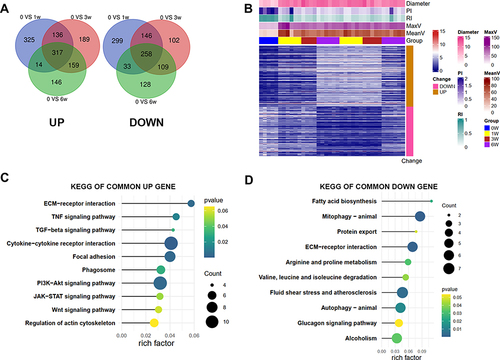
Figure 5 Co-expression network constructed by WGCNA to identify the key modules related to the VH progression. (A) outliers detection based on hierarchical clustering (B) the calculation of the optimal soft threshold (C) the construction of gene co-expression modules (D) the heat map of 400 genes randomly selected from these modules (E) the relationships of modules and sample traits (F) four key modules highly correlated with the “Times” trait (correlation > 0.5 or < −0.5).
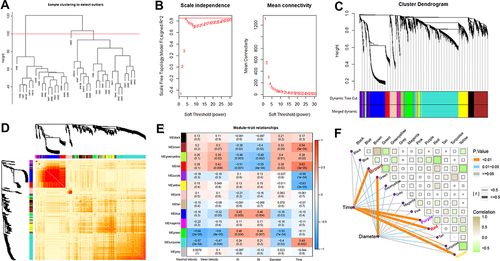
Figure 6 STEM analysis to identify gene clusters and pathways. (A) identification of eight clusters (cluster 48, 42, 49, 29, 30, 1, 9, 40) based on STEM analysis of the genes from key WGCNA modules; (B) the heat map of genes in the eight significant clusters; (C) the KEGG pathways identified by the Cluego. (D) the expression patterns of genes involved in six important biological functions.
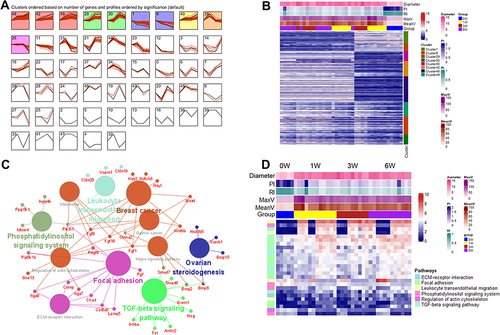
Figure 7 Identification of candidate genes and construction of miRNA-Gene network. (A) the top 15 genes identified by the DMNC algorithm; (B) the relationships of 13 different expression genes during venous hypertension; (C) the miRNA–mRNA–modules network. *p-value < 0.05, **p-value < 0.01, ***p-value < 0.001.
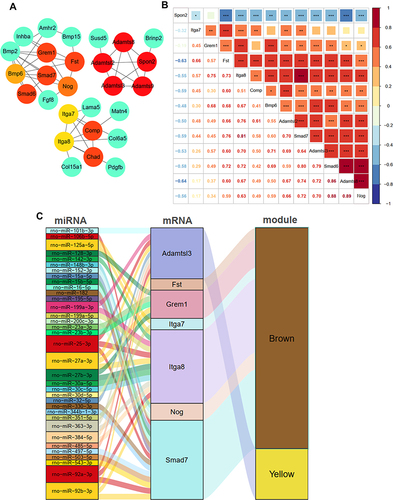
Table 2 Identified 9 Small Molecular Components from CMAP
Table 3 Primers Used for Quantitative RT-qPCR Analysis
Figure 8 Validation of the expression levels of five candidate genes (Adamts8, Adamtsl2, Adamtsl3, Itga8, and Spon2) by RT-qPCR among groups. *p-value < 0.05, **p-value < 0.01, ***p-value < 0.001.
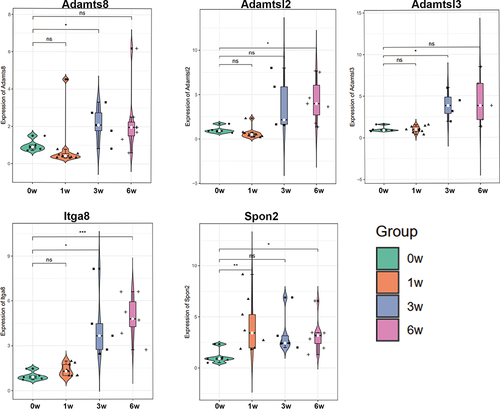
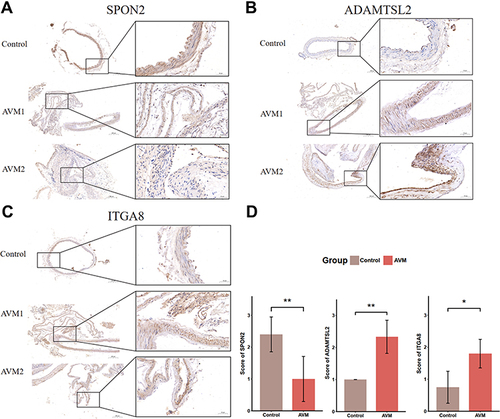
Figure 9 Detection of SPON2, ADAMTSL2, and ITGA8 in human tissue sample. Immunohistochemical staining of control (up) and AVM (middle and bottom) tissue samples for SPON2 (A), ADAMTSL2 (B) and ITGA8 (C). (D) shows the significant difference of staining scores of SPON2, ADAMTSL2, and ITGA8. AVM indicates brain arteriovenous malformations. *p-value < 0.05, **p-value < 0.01.