Figures & data

Figure 1 The impact of MGHS40 and PS80 on the molecular pathways of fatty acids desaturation and desaturase enzymes. Red color indicates the pathways associated with macrophages stimulation, mostly by SCD1 activation. MGHS40 directly translates into stearate content that undergo desaturation by SCD1. Green color shall be identified with the molecular pathways of fatty acids desaturation that do not induce macrophages saturation. PS80, as a oleate derivative can be processed in cells by the ELOVL-family enzymes that do not affect macrophages turnover and by D6D that has only minimal impact on macrophages (brown color).
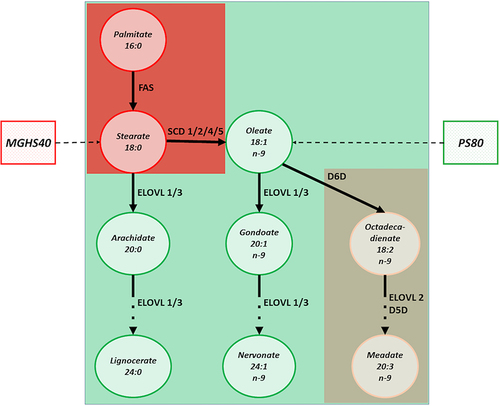
Figure 2 The concentration assays. (A) The impact of applied excipients on human peripheral blood monocytes counts and shape after 3 days of culture. The cell shape change from round to polypoidal was observed, especially in pf-latanoprost and MGHS40-treated cells, when compared with pf-tafluprost- and PS80-treated cells. Scale bar = 50 µm. (B) The percentage of polypoidal cells in culture on day 3. Cell count was performed using ImageJ software from five visual fields of each well under 20× magnification (AxioVert, Zeiss, Germany). Small cells with round shapes were recognized as monocytes, and large, elongated, ameboid or spindled cells with processes and intracellular granules were recognized as macrophages. An increase in pf-latanoprost concentration stimulated transformation into polypoidal cells, while an increase in pf-tafluprost concentration decreased this phenomenon. (C) The LDH cytotoxicity assay performed in medium after 3 days of culture exposed to 0.1% concentrations of excipients (p>0.05, ANOVA).
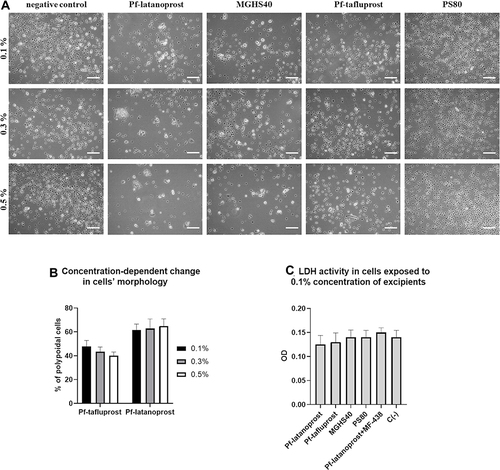
Figure 3 Morphological types of cells in culture. Monocytes appeared as small, round cells with no spindles and with visible kidney-shaped nuclei. They were observed in all culture groups, especially in groups with lower macrophage counts (pf-tafluprost, PS80 and negative control). M0-like macrophages were characterized by a rosette-shaped morphology with long spindles and intracellular granulations. They were observed in all groups, except pf-tafluprost, the negative control and PS80. The absence of the M0 type was accompanied by the absence of the M1 type. The M1-like cells had elongated cell bodies with long spindles, and M2-like cells were amoeboid and contained yellow granulations.
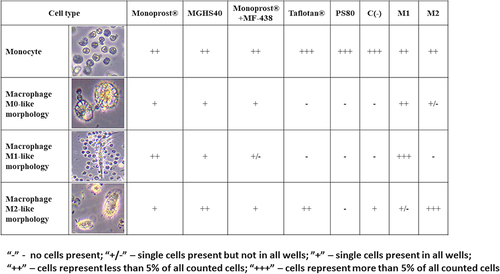
Figure 4 The polarization of monocytes toward an M1 or M2 morphology, depending on the applied derivatives. The exclusive presence of M0 macrophages and monocytes was observed until Day 5 in all groups (A and B), and the presence of monocytes was observed only throughout the entire experiment in the group treated with PS80 (F). M1 differentiation was pronounced on Day 7 in an increasing manner in the pf-latanoprost (H), MGHS40 (E) and M1-positive control group (C), while M2 differentiation was pronounced in the pf-tafluprost (G), MGHS40 (E) and M2-positive control group (D). Scale bar = 50 µm.
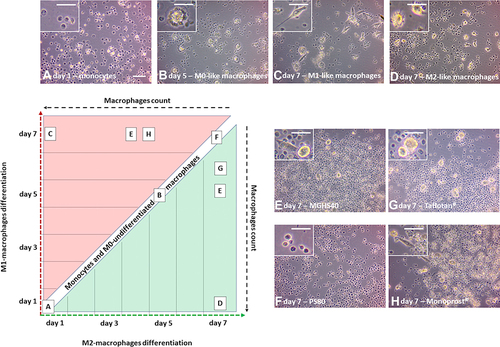
Figure 5 The impact of SCD1 inhibitor, MF-438, on the macrophages content in cell culture exposed to certain excipients. Overall, the highest percentage of macrophages was observed in M2- and M1-positive controls (39.2% and 36.3%, respectively), followed by the pf-latanoprost (33.6%) and MGHS40 (32.9%) groups. The application of MF-438 (SCD1 inhibitor) reduced the percentage of macrophages in the pf-latanoprost culture by approximately threefold compared with pf-latanoprost alone (13.5% vs 33.6%, p<0.01, Student’s t-test). Pf-tafluprost induced monocyte differentiation comparable to that of the negative control (17.6% and 18.6%, respectively), while PS80 completely inhibited monocyte/macrophage turnover. **p<0.01.
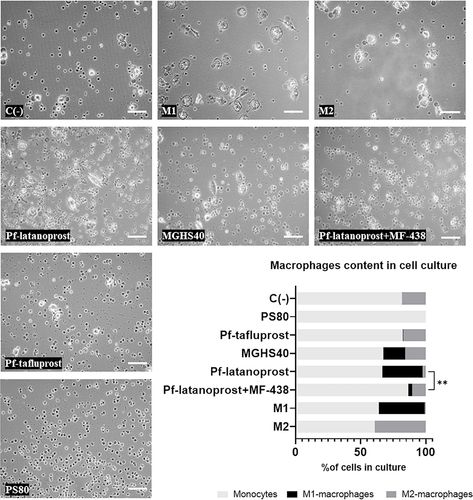
Figure 6 Immunostaining of rabbit eyelid cross-sections after 8-week exposition to pf-tafluprost or pf-latanoprost. In green M1-macrophages positive for CD80 present predominantly in tissue exposed to pf-latanoprost. These cells were observed within the tarsal glands (scale bar = 20 µm), eyelid stroma (scale bar = 50 µm) and tarsal epithelium (scale bar = 20 µm) of rabbits exposed to commercially available eye drops.
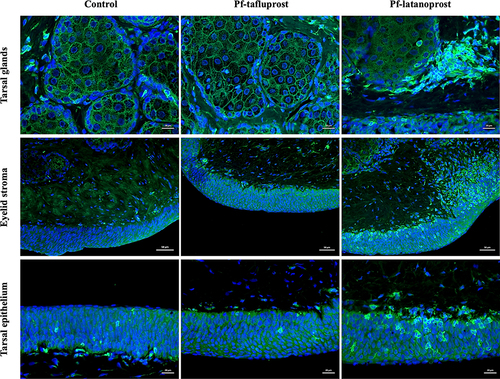
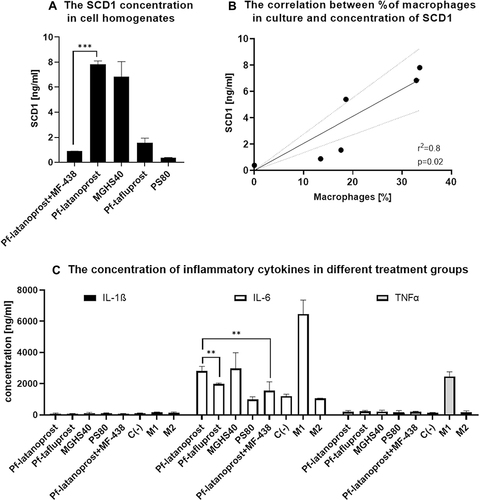
Figure 7 The molecular analysis of cell homogenates after 7-day exposition to analyzed excipients. (A) ELISA results showing the concentration of SCD1. The highest concentration of SCD1 desaturase was measured in the pf-latanoprost and MGHS40 groups, whereas MF-438 treatment decreased the SCD1 concentration by approximately sevenfold (p<0.001, Student’s t-test). Pf-tafluprost and PS80 treatment resulted in significantly lower concentrations of SCD1 in treated cells (p<0.05 Student’s t-test). (B) A significant positive correlation between the concentration of SCD1 and the percentage of macrophages in culture was observed (p=0.02, r2=0.8, Pearson’s correlation). The concentration of SCD1 in M1- and M2-positive controls was not related to the percentage of macrophages due to different turnover stimuli; thus, these groups were excluded from correlation analysis. (C) Proinflammatory markers in cell homogenates analyzed with MULTIPLEX Assay. Due to test sensitivity, we were able to detect only IL-1β, IL-6 and TNFα. For these cytokines, there were significant differences between groups. The IL-6 concentration was significantly higher in the pf-latanoprost group (2812.5±296 ng/mL) than in the pf-tafluprost group (1993±45 ng/mL) (p=0.01, Student’s t-test). Treatment with the SCD1 inhibitor decreased the IL-6 concentration in the pf-latanoprost group from 2812.5±296 ng/mL to 1555.75±134 ng/mL (p=0.01, Student’s t-test). For TNFα and IL-1β concentrations, we did not detect significant differences (p>0.05, ANOVA), except in the M1 control group, which additionally confirmed the proinflammatory features of these cells. ***p<0.001; **p<0.01.