Figures & data
Figure 1 CBLEB treatment alleviates SP infection-induced weight loss, abnormal blood indicator levels and immune dysfunction. (A) Weight plot. (B) Thymus and spleen indexes. (C) Basophil counts and percentages, red cell distribution width, total protein, albumin, indirect bilirubin, urea acid, and RANTES levels in blood samples. #P < 0.05; ###P < 0.001 versus the SP group in weight plot; *P < 0.05; **P < 0.01; ***P < 0.001.
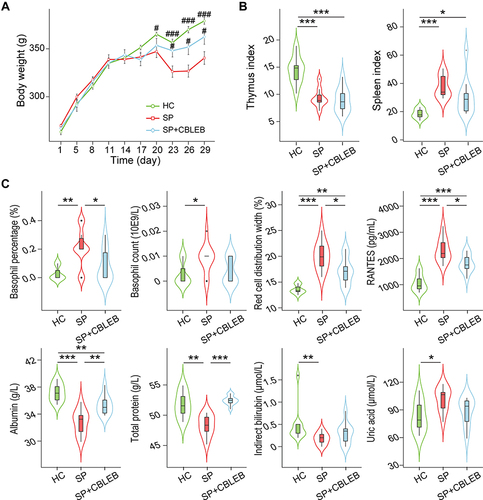
Figure 2 CBLEB treatment partially alleviated SP infection-induced organ damage. (A) Representative images of lung samples stained by H&E and the corresponding histological scores. (B) Representative images of spleen samples stained by H&E and the corresponding histological scores. *P < 0.05; **P < 0.01; ***P < 0.001.
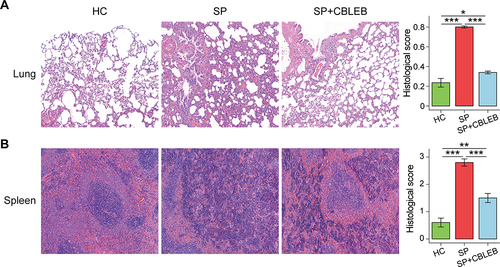
Figure 3 CBLEB treatment alleviates SP infection-induced dysbiosis of the gut microbiota. (A) Box plot of flora diversity and species richness estimated based on the Shannon indexes and Chao1 indexes. (B) Two-dimensional PCoA plot based on the unweighted UniFrac matrix confirmed by ANOSIM. (C) Alterations in the relative abundance of bacterial taxa in the SP, SP+CBLEB, and HC groups at the family and genus levels. *P < 0.05; **P < 0.01; ***P < 0.001.
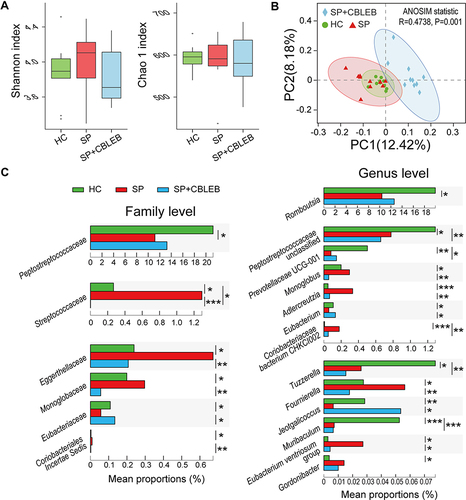
Figure 4 CBLEB alleviates SP infection-induced gut metabolism disorder. (A) OPLS-DA plot illustrating clear separation of gut metabolic profiles of the SP, SP+CBLEB, and HC groups. (B) VIP values of 12 metabolites with the highest contribution to the separation of the three groups in the OPLS-DA model. (C) Levels of fourteen differentially distributed metabolites in the three groups. *P < 0.05; **P < 0.01; ***P < 0.001.
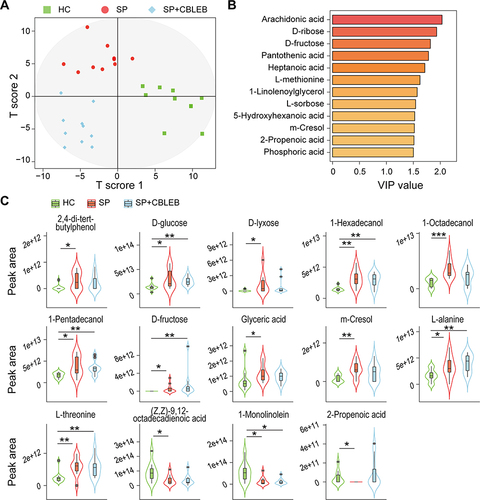
Figure 5 CBLEB alleviates SP infection-induced serum metabolism dysbiosis. (A) OPLS-DA plot illustrating clear separation of serum metabolic profiles of the SP, SP+CBLEB, and HC groups. (B) VIP values of 6 metabolites with the highest contribution to the separation of the three groups in the OPLS-DA model. (C) Levels of eight differentially distributed metabolites in the three groups. *P < 0.05; **P < 0.01; ***P < 0.001.
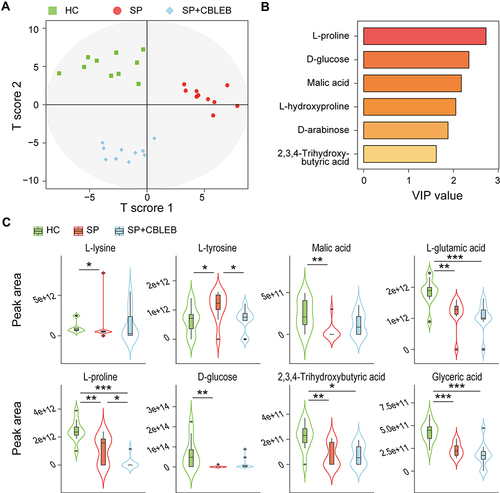
Figure 6 Pathways altered by SP infection and whose alterations were alleviated by CBLEB in the lung and colon. (A) Pathways upregulated or downregulated by SP infection and those whose alterations were alleviated by CBLEB in the lung. (B) Pathways upregulated or downregulated by SP infection and those whose alterations were alleviated by CBLEB in the colon. n = 3 in all groups; black vertical lines represent -Log2 P = 4.32 corresponding to P = 0.05; plots with P ≥ 0.05 are not displayed.
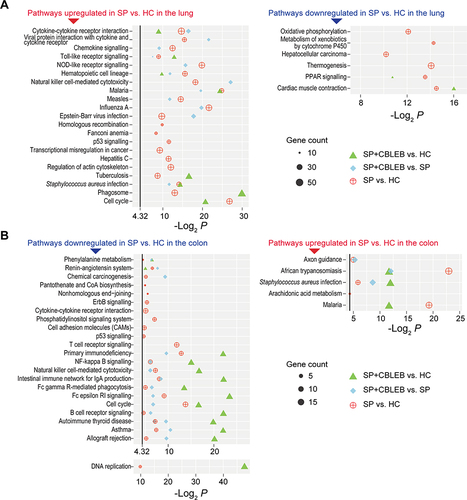
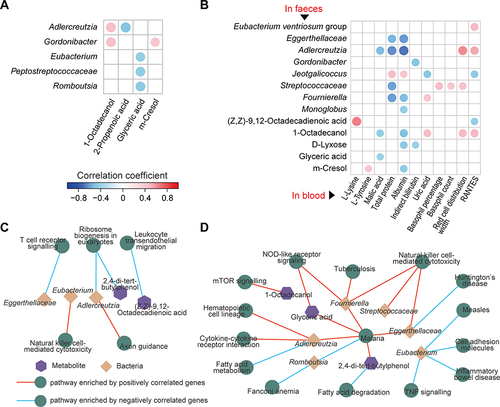
Figure 7 Associations among faecal bacteria, faecal and serum metabolites, and gut and lung pathways influenced by CBLEB. (A) Correlation of CBLEB-influenced faecal bacteria with faecal metabolites (P < 0.01). (B) Correlation of CBLEB-influenced faecal bacteria and metabolites with blood metabolites, liver and kidney function indicators, and cytokines (P < 0.01). (C and D) Pathways enriched by genes that were positively or negatively correlated with individual faecal bacteria or metabolites according to the KEGG database in the colon (C) and lung (D) (P < 0.001).