Figures & data
Figure 1 Effect of crocin on ICIs-related myocarditis in myocardial contractile function. (A) BALB/c mice were randomly assigned to four groups (n=10 in each group): (1) control group (CON, vehicle-treated group); (2) ICIs-related myocarditis group (ICIs, model group); (3) ICIs-related myocarditis + low-crocin (Crocin-L, crocin i.p. 20mg/kg/d); (4) ICIs-related myocarditis + high-crocin (Crocin-H, crocin i.p. 50mg/kg/d). Except for control group, all mice were immunized subcutaneously on day 0 and day 7, respectively with murine cardiac TnI peptide. From day 7 onwards, mice were given anti-mouse PD-1 every 2 days for 5 times. Crocin was given from day 8 for 14 consecutive days. On day 21 since the first immunization, mice were killed after the implementation of echocardiography, and the heart tissues were obtained. (B) Representative images of thoracic echocardiography. (C and D) Quantifications of ejection fraction (EF) and fraction shortening (FS). (E–H) Quantifications of systolic left ventricular anterior wall (LVAW; s), diastolic left ventricular anterior wall (LVAW; d), and systolic left ventricular posterior wall (LVPW; s) and diastolic left ventricular posterior wall (LVPW; d). The data were expressed as mean ± SD. *p < 0.05 and ***p< 0.001.
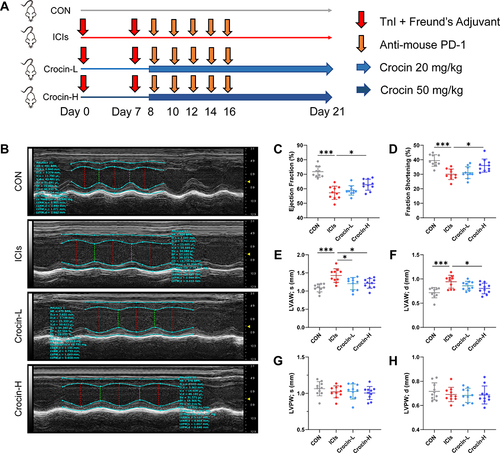
Figure 2 Effect of crocin on ICIs-related myocarditis in myocardial inflammation, fibrosis, and myocardial injury. Representative images of HE staining (A), Masson staining (B) and Sirius Red staining (C) of inflammatory manifestations, myocardial fibrosis and collagen deposition in heart sections. Scale bar = 100 μM. (D–F) Quantifications of the inflammatory area, fibrosis area and collagen volume fraction. (G–K) Serum levels of creatine kinase (CK), creatine kinase-MB (CK-MB), lactate dehydrogenase-1 (LDH-1), cardiac troponin T (cTnT) and cardiac troponin I (cTnI). The data were expressed as mean ± SD. *p < 0.05, **p < 0.01 and ***p< 0.001.
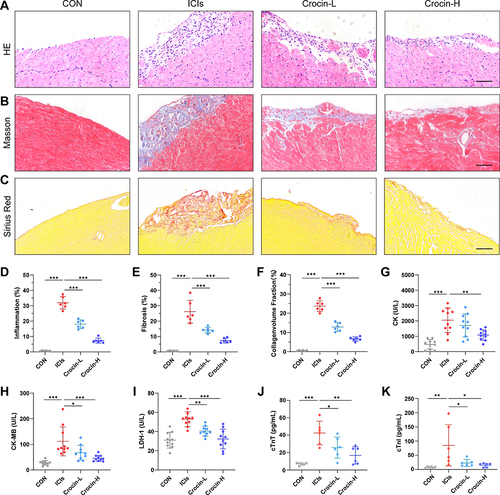
Figure 3 Effect of crocin on ICIs-related myocarditis in NLRP3 mediated pyroptosis. (A–F) Representative images and quantitative analysis of Western blotting analysis of pyroptosis-related proteins (NLRP3, GSDMD, Cleaved GSDMD, Caspase 1, Cleaved Caspase1, interleukin-1β (IL-1β) and IL-18. (G) Representative images of double-stained immunofluorescence of NLRP3 (red) and cardiac troponin T (cTnT) (green) in heart sections. The nuclei were stained with DAPI (blue). Scale bar = 100 μM. (H) Quantification of NLRP3 fluorescence intensity. (I and J) Serum levels of IL-1β, IL-18. The data were expressed as mean ± SD. *p < 0.05, **p < 0.01 and ***p< 0.001.
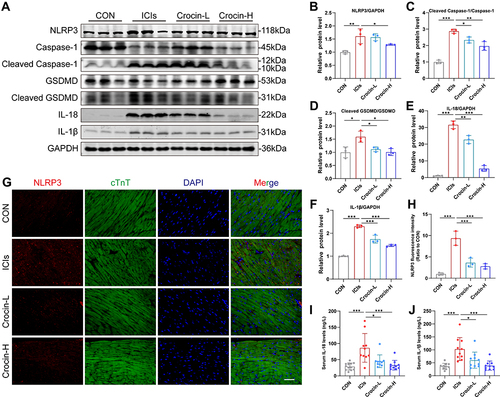
Figure 4 Effect of crocin on LPS-induced pyroptosis in vitro. Lipopolysaccharide (LPS) was used to induce pyroptosis in vitro. HL-1 cells were pre-incubated with crocin at different concentrations (0, 5, 10, 20, 50μM) for 30 minutes and then stimulated with LPS at 1μg/mL for 24 hours to evaluate the protective effect of crocin in the NLRP3 mediated pyroptosis. (A) Cell viability was detected by CCK-8 cell viability assay. (B–G) Representative images and quantitative analysis of Western blotting analysis of pyroptosis-related proteins (NLRP3, GSDMD, Cleaved GSDMD, Caspase 1, Cleaved Caspase1, interleukin-1β (IL-1β) and IL-18). (H and I) Cell culture supernatant levels of IL-1β and IL-18. (J) Representative images of immunofluorescence of NLRP3 (red) in HL-1 cells. The nuclei were stained with DAPI (blue). Scale bar = 100 μM. (K) Quantification of NLRP3 fluorescence intensity. The data were expressed as mean ± SD. *p < 0.05, **p < 0.01 and ***p< 0.001.
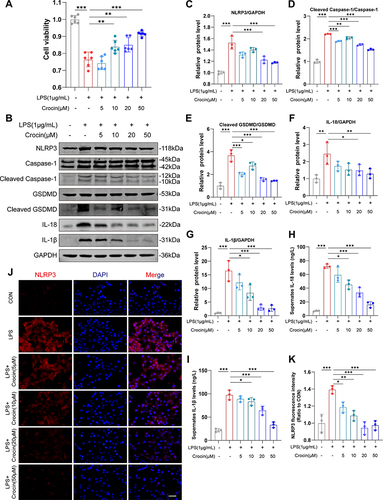
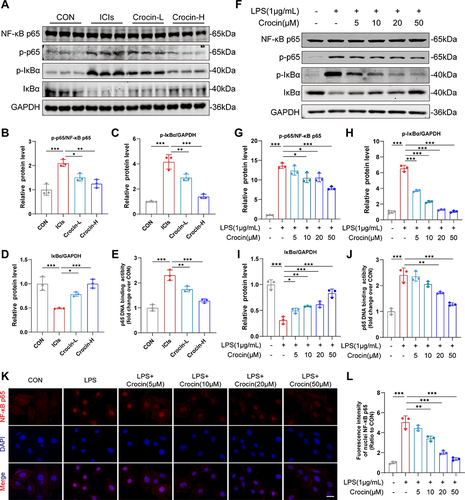
Figure 5 Effect of crocin on NFκB pathway in vivo and in vitro. (A–D) Representative images and quantitative analysis of Western blotting analysis of NFκB pathway (NFκB p65, p-p65, p-IκBα and IκBα) in mice myocardium after the administration of immunization, anti-PD-1, and crocin. (E) p65 DNA binding activity in heart nuclear extracts was measured. (F–I) Representative images and quantitative analysis of Western blotting analysis of NFκB pathway (NFκB p65, p-p65, p-IκBα and IκBα) in HL-1cells pretreated with crocin at different concentrations before LPS stimulation. (J) p65 DNA binding activity in HL-1 nuclear extracts was measured. (K) Representative images of immunofluorescence of NFκB p65 nuclear transfer (red) in HL-1 cells. The nuclei were stained with DAPI (blue). Scale bar = 50 μM. (L) Quantification of nuclei NFκB p65 fluorescence intensity. The data were expressed as mean ± SD. *p < 0.05, **p < 0.01 and ***p< 0.001.