Figures & data
Table 1 The Demographics and Baseline Clinical Data of the Sepsis Patients for RAAS Establishment
Table 2 The AUC of Each Parameter for RAAS in Different Survival Length at Two Cohorts
Figure 1 Primary cohort ROC and validation cohort ROC. Figure 1-1, The AUC of each parameter for RAAS was calculated using the primary cohort. Figure 1-2, The ROC of each parameter for RAAS was calculated using the validation cohort. A, B and C refer to the 30 days, 60 days and 90 days, respectively. D, E and F refer to the 180 days, 365 days and 730 days, respectively. ROC (receiver operator characteristic curve). RAAS(RDW, AGE, APACHE II, SOFA).
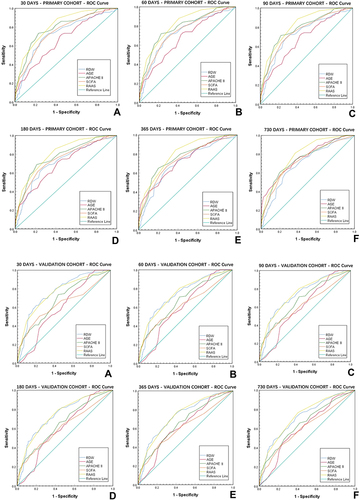
Figure 2 Kaplan–Meier curve of 30, 60, 90, 180, 36, 730 days survival according to the four groups (group-1:0–1, group-2:2–3, group-3:4–5, group-4:6) using the RAAS scoring system. (A–F) for primary cohort, and (G–L) for validation cohort, *p<0.05. There are significant differences between the two randomly selected from 4 group.
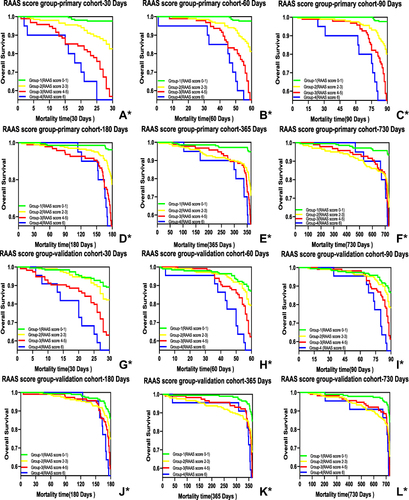
Figure 3 Calibration plots of the primary model and the verification model. Ideally, all groups of predicted probabilities fit close to the dashed diagonal line (perfect calibration). Vertical lines in each group represent 95% confidence intervals of estimated probability. A, B and C refer to the 30 days, 60 days and 90 days calibration plot in primary cohort; D, E and F refer to the 30 days, 60 days and 90 days calibration plot in validation cohort.
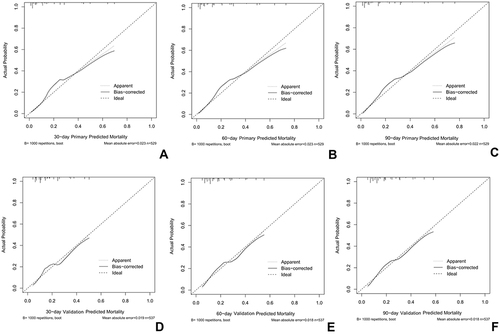
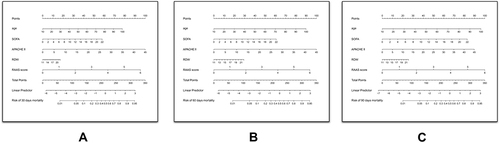
Figure 4 Validated nomogram for predicting 30-day, 60-day and 90-day mortality of sepsis. When using it, drawing a vertical line from each variable upward to the points and then recording the corresponding points (ie, RDW=17=50 points). The point of each variable was then summed up to obtain a total score that corresponds to a predicted probability of 30-day, 60-day and 90-day death at the bottom of the nomogram. (A) the nomogram for the risk of 30 days mortality. (B) the nomogram for the risk of 60 days mortality. (C) the nomogram for the risk of 90 days mortality.