
Figures & data
Figure 1 The study population flowchart.
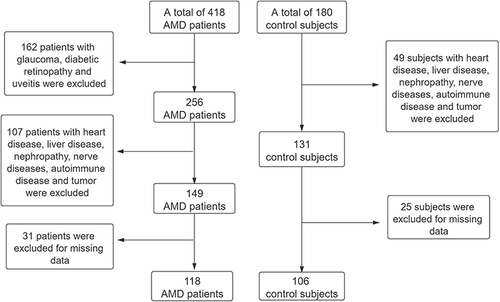
Table 1 Demographic and Clinical Characteristics of AMD Patients and Controls
Figure 2 Comparison of complement levels between AMD patients and control group.
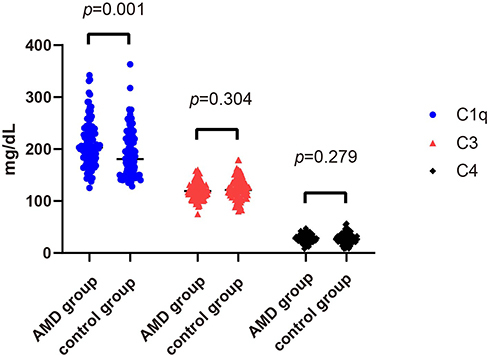
Table 2 Comparison of Complement Levels Between Male and Female AMD Patients and Controls
Figure 3 Gender subgroup comparison of complement levels between AMD patients and control group. (A) the comparison between male AMD patients and control subjects; (B) the comparison between female AMD patients and control subjects.
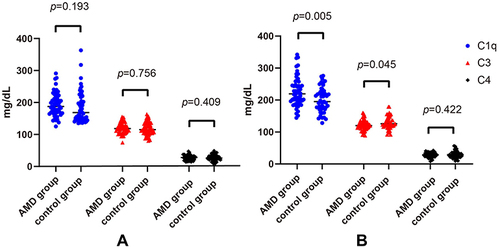
Table 3 Comparison of Complement Levels in Age Subgroups of Male AMD Patients and Controls
Table 4 Comparison of Complement Levels in Age Subgroups of Female AMD Patients and Controls
Figure 4 The proportion of AMD patients and control subjects in subgroups defined by the mean of C1q and C3. (A) subgroup defined by the mean of C1q. Q1: C1q≤200.43mg/dL, and Q2: C1q>200.43mg/dL; (B) subgroup defined by the mean of C3. Q3: C3≤121.51mg/dL, Q4: C3>121.51mg/dL.
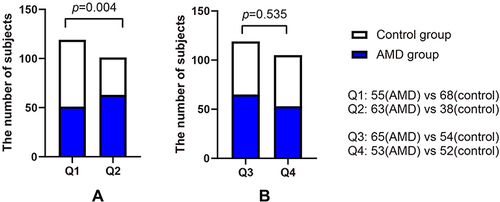
Table 5 Logistic Regression Models Evaluating the Risk Factors for AMD