Figures & data
Figure 1 Inflammation levels and TLR3 protein expression in esophageal tissues at different pathologic stages. (A) Schematic diagram of esophageal tissues sampling. The stars in various colors from top to bottom in the esophageal mucosa represent respectively: esophageal squamous cell carcinoma (ESCC, inside tumor), tumor proximal tissue of early lesions for identifying esophageal squamous simple hyperplasia (ESSH) and intraepithelial neoplasia (IEN), and distant non-malignant tissue. (B) Microscopic images of esophageal tissues at different pathologic stages with different levels of inflammation and TLR3 protein expression, i–ii, Normal: rare inflammation; v–vi, ESSH: general mild inflammation; ix–x, IEN: common moderate or severe inflammation; xiii–xiv, ESCC. IHC showing TLR3 expression from normal (iii–iv), ESSH (vii–viii), IEN (xi–xii) to ESCC (xv-xvi). Scale bars:100 μm (i, iii, v, vii, ix, xi, xiii and xv) and 40 μm (ii, iv, vi, viii, x, xii, xiv, and xi). (C) Correlation between inflammation score and histologic types. Rho indicates Spearman rank correlation coefficient. (D) The protein expression levels of TLR3 in 37 paired esophageal tissues: Normal, ESSH, IEN, and ESCC samples. P < 0.0083 (α=0.05/6) was considered statistically significant in pairwise comparison. (E) Correlation between inflammation score and TLR3 H-score (the High and Low TLR3 groups are based on the ROC curve). **P < 0.01; *** P < 0.001; “ns” indicates no significance.
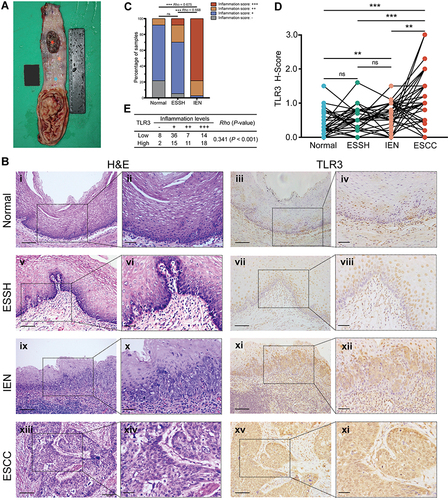
Table 1 Clinicopathological Parameters of ESCC Patients in IHC Samples
Figure 2 The expression and ROC curves of TLR3 in IHC samples and TCGA. (A) The protein expression levels of TLR3 in ESCC and adjacent normal tissue samples. (B) The mRNA expression levels of TLR3 in GTEx (n=518), TCGA ESCC-Normal (n=3) and TCGA ESCC-Tumor samples (n=92). (C) The mRNA expression levels of TLR3 in GTEx (n=518), TCGA ESCA-Normal (n=13) and TCGA ESCA-Tumor samples (n=181). (D) ROC curve shows that TLR3 had an AUC value of 0.822 (95% CI: 0.755–0.890) to discriminate between ESCC tissues from non-tumor controls in our sample. With a cutoff of 0.725, the sensitivity, specificity, and accuracy were 74.6, 82.0, and 76.5%, respectively. (E) TLR3 had an AUC value of 0.679 (95% CI: 0.603–0.755) in the ROC curve for TCGA-ESCC. (F) TLR3 had an AUC value of 0.707 (95% CI: 0.658–0.757) in the ROC curve for TCGA-ESCA. *P < 0.05, ***P < 0.001; ns, no significance.
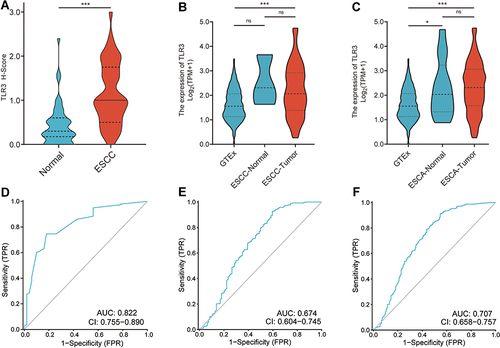
Figure 3 Correlations between TLR3 expression and DNA levels in TCGA ESCC patients. (A) Correlation between TLR3 expression and clinical parameters, copy number, and DNA methylation. The statistics, including correlation coefficient (r) and p-value, are on the right. (B) Summary view of DNA methylation differences in which the samples had been divided into two groups based on their TLR3 expression level. The horizontal lines at each probe position represent the median percentage of methylation (β Value), while the vertical lines indicate the range between 25% and 75%. (C) Scatter diagram and correlation analysis of TLR3 expression and methylation levels of CpG sites, including cg06498520, cg17671280, cg12281049, and cg25367691. *P <0.05, **P <0.01, **P <0.001.
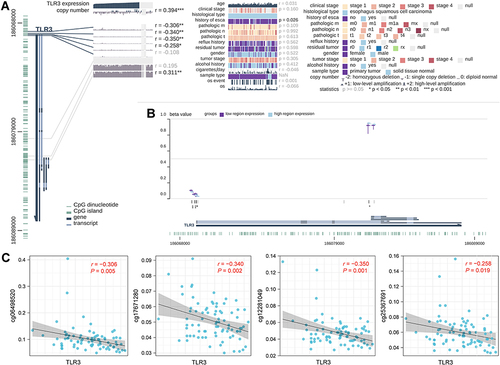
Table 2 Cox Regression Univariate Analysis in Patients with ESCC in IHC Samples
Table 3 Cox Regression Multivariate Analysis in Patients with ESCC in IHC Samples
Figure 4 Survival curves for TLR3 in IHC samples and TCGA. (A) Survival curves in IHC samples indicated that ESCC patients with low TLR3 protein expression had a shorter OS (i) and DSS (ii) than those with high-level of TLR3 (15.4 vs 26.7 months, P = 0.006; 15.4 vs 27.3 months, P = 0.003, respectively) in the IHC samples. (B) Stratified by TMN stage, i. there was no statistical significance in stage III (P = 0.635); ii, iii. the OS of stage IV or combined stage III and IV patients with high TLR3 level was significantly longer than that of patients with low TLR3 level (P = 0.024 and P = 0.025, respectively). (C) The survival curves for having received postoperative chemotherapy (i, P = 0.059) or radiotherapy (ii, P = 0.690) patients in IHC samples. (D) The survival curves of OS in the TCGA-ESCC patients. i. all the data; ii. TNM stage III (P = 0.033, HR = 0.199, 95% CI: 0.045–0.874); iii. TNM stage II. (E) ESCA patients with low TLR3 mRNA expression had a shorter OS than those with high levels of TLR3 (13.2 vs 18.3 months, P = 0.028) in the Kaplan-Meier survival curves from the TCGA.
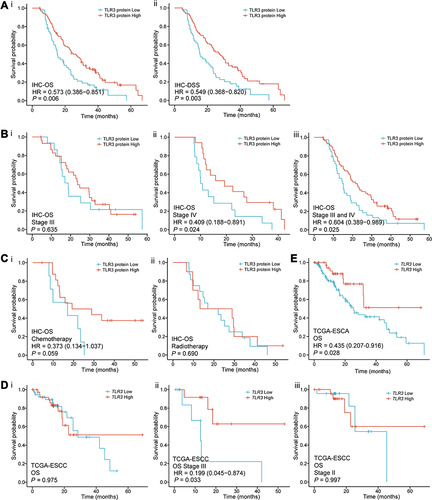
Figure 5 Interaction network of frequently interacting genes and functional enrichment analyses. (A) Gene to gene interaction network with frequently interacting genes (GeneMANIA, accessed on Sept 8th, 2021): the node size, color of lines, and colored node circle sections represent the strength of interaction, the types of interaction between genes, and functions of the respective genes, respectively. (B) GO enrichment and KEGG pathway analyses of 21 involved genes. (C) Correlation analyses between the expression of TLR3 and co-expressed genes in ESCC. SIGLEC7, sialic-acid binding Ig-like lectin 7; SIGLEC9, sialic-acid binding Ig-like lectin 9; SIGLEC10, sialic-acid binding Ig-like lectin 10; SIGLEC11, sialic-acid binding Ig-like lectin 11; TICAM2, toll-like receptor adaptor molecule 2; WDFY1, WD repeat and FYVE domain containing 1.
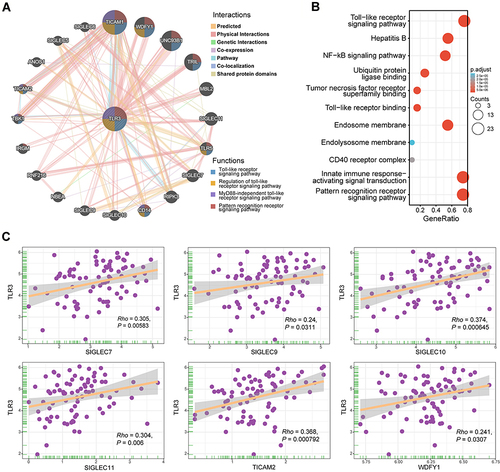
Figure 6 Correlations between TLR3 expression and immune infiltration level predict immunotherapeutic response. (A) Scatter diagram and correlation analysis of TLR3 expression with six types of immune infiltration levels, including CD8+ T cells, CD4+ T cells, B cells, neutrophils, macrophages, and dendritic cells in TCGA ESCC. Results are also shown after being adjusted for tumor purity. (B) Boxplot showing stromal, immune, and ESTIMATE scores within TLR3low and TLR3high groups. (C) i. Heatmap of biomarkers for prediction of immunotherapeutic response from the TIDE dataset, including IFN-γ, Merck18 (T cell-inflamed signature), PD-L1, CD8, dysfunction, exclusion, MDSCs, CAFs, and TAM-M2 (M2 subtype). ii. Violin plot showing IFN-γ, Merck18, CD8, exclusion, dysfunction, and TAM-M2 scores within TLR3low and TLR3high groups. (D) Violin plot showing T cells, CD8+ T cells, CTLs, B-cell lineage, NK cells, monocytes, myeloid dendritic cells (mDCs), neutrophils, and CAFs between TLR3low and TLR3high groups. *P < 0.05, **P < 0.01, ***P < 0.001; “ns” indicates no significance.
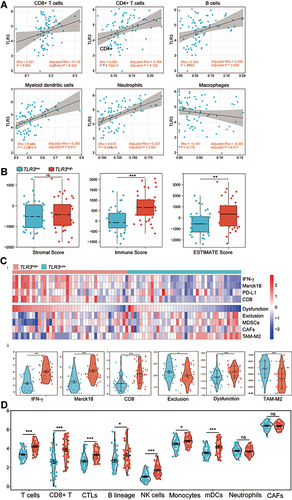
Table 4 Correlations Between TLR3 and Infiltrating Immune Cells and Mann–Whitney U-Test Between TLR3low and TLR3high Groups
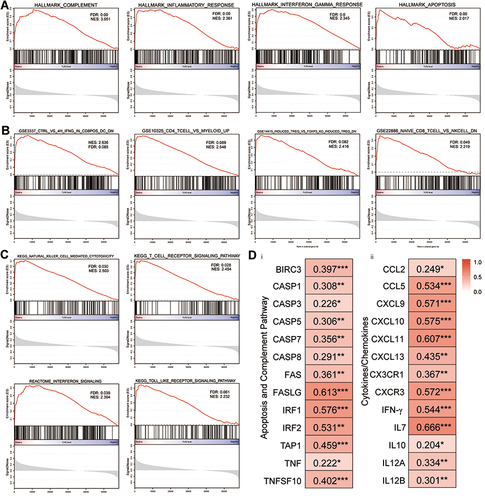
Figure 7 Canonical pathway analysis using GSEA and the relationship between TLR3 and related genes of signaling pathways, cytokines, and chemokines. (A) The most significant pathways in terms of the hallmark gene sets. (B) The most significant pathways in terms of the immunologic signature gene sets. (C) The most significant pathways in terms of the curated gene sets. (D) Correlations between TLR3 expression and gene expression changes in the apoptosis and complement signaling pathways (i), and cytokines and chemokines patterns (ii) in the tumor immune microenvironment. *P < 0.05, **P < 0.01, ***P < 0.001.