Figures & data
Figure 1 Ginsenoside Rb1 reduced lipid accumulation in diabetic mice. (A) body weight; (B) blood glucose level and (C) body fat level of 36-week-old mice after 12 weeks of treatment. (D) serum insulin; (E) FFA; (F) CHO; (G) TG; (H) HDL and (I) LDL in indicated groups. Data are expressed as the mean ± SEM (n = 3–6). *p<0.05 or **p<0.01 vs model group; ##p<0.01 or ###p<0.001 vs the control.
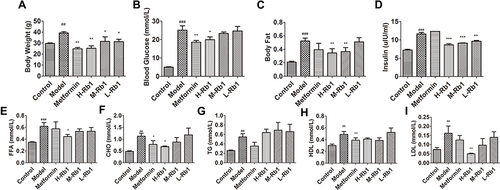
Figure 2 Ginsenoside Rb1 improved secretion of adipocytokines and lipid accumulation in adipocytes. (A) CRP1; (B) MCP1; (C) TNFα; (D) IL-1β; (E) IL-6; (F) adiponectin levels and (G) leptin in sera of different groups. (H) MTT assay showing 3T3-L1 cell viability treated using different concentrations of ginsenoside Rb1. (I) BODIPY staining images showing lipid accumulation in 3T3-L1 cells and (J) quantification of green fluorescence in different groups. H-Rb1, 20μM ginsenoside Rb1, M-Rb1, 40μM ginsenoside Rb1, L-Rb1, 80μM ginsenoside Rb1. Scale bar, 200 μm. Data are expressed as the mean ± SEM (n = 3–6) *p<0.05 or **p<0.01 or ***p<0.001 vs model group; ##p<0.01 or ###p<0.001 vs the control.
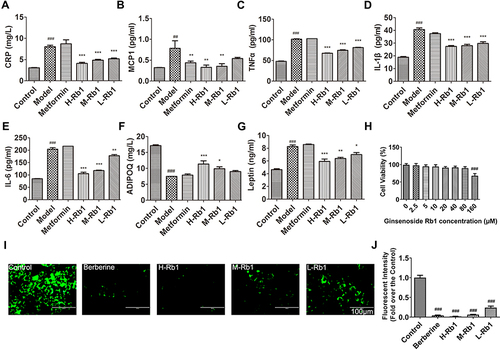
Figure 3 Ginsenoside Rb1 ameliorated cardiac dysfunction in diabetic mice. (A) Representative images of echocardiography from mice after 12 weeks of treatment. Statistical analyses of (B) LVAWd; (C) LVPWd; (D) LVIDd; (E) EF and (F) FS in indicated groups. Serum (G) CK; (H) CK-MB and (I) LDH in indicated groups. Data are expressed as the mean ± SEM (n = 3–6). *p<0.05 or **p<0.01 vs model group; #p<0.05 or ##p<0.01 or ###p<0.001 vs the control.
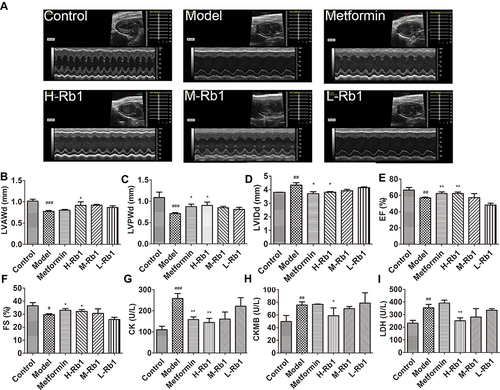
Figure 4 Ginsenoside Rb1 reduced myocardial inflammation, hypertrophy, fibrosis, and apoptosis in diabetic mice. (A) Representative images of hematoxylin–eosin (HE) staining and (B) cross-sectional areas in indicated groups. (C) Representative images of Masson staining and (D) statistical analyses of fibrotic ratios in different groups. (E) Representative TUNEL staining images and (F) statistical analyses of cardiomyocyte apoptotic index in six groups. Scale bar, 50 μm. Data are expressed as the mean ± SEM (n = 3–6). ***p<0.001 or *p<0.05 vs model group; ###p<0.001 vs the control.
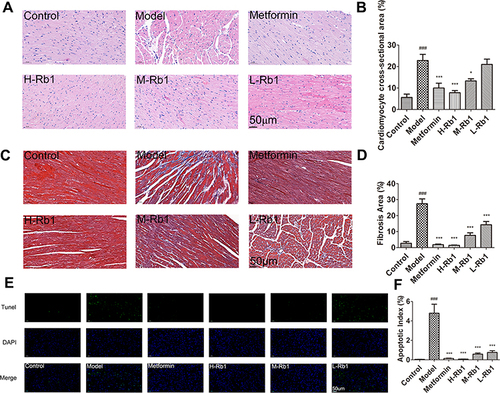
Figure 5 Ginsenoside Rb1 reduced lipid accumulation and promoted adipocytokine-mediated glucose and lipid metabolism in diabetic heart. (A) Representative images of Oil red O staining and (B) quantitative analysis of Oil red O staining in six groups. Scale bar, 50 μm. Transcription levels of genes involved in (C) adipocytokine pathway, (D) lipid and (E) glucose metabolism in indicated four groups. Data are expressed as the mean ± SEM (n = 3–6). *p<0.05 or **p<0.01 or ***p<0.001 vs. model group; ###p<0.001 or ##p<0.01 or #p<0.05 vs the control.
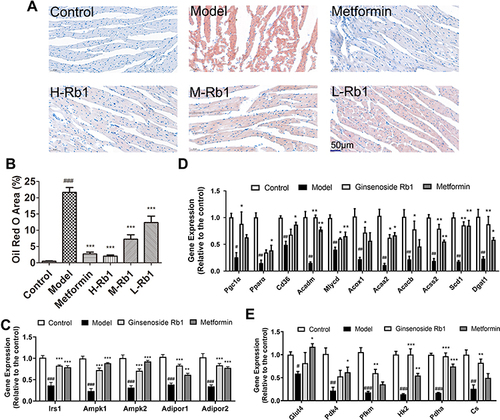
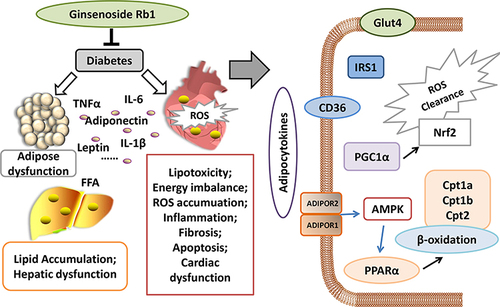
Figure 6 Schematic figure illustrating the mechanism of ginsenoside Rb1 in treating diabetic cardiomyopathy. Under obese or diabetic conditions, adipose function is impaired, and excess lipids and abnormal adipocytokines are released into the serum, thereby influencing systemic organs, including the heart. In diabetic heart, more fatty acids are utilized to generate energy, producing excessive ROS that accumulate in cardiomyocytes and induce oxidative stress. Oxidative stress and pro-inflammatory cytokines from the adipose tissue can cause cardiac inflammation, fibrosis, and apoptosis, subsequently leading to cardiac dysfunction and heart failure. The present study showed that ginsenoside Rb1 improved adipocytokine pathway, improved the body weight as well as body fat and serum lipids of diabetic mice; these changes influenced cardiac glucose and lipid metabolism and exerted a preventive effect on diabetic cardiomyopathy.