Figures & data
Table 1 Baseline Characteristics of Breast Cancer Patients in TCGA and GEO Datasets
Table 2 The Chromosomal Locations of Copy Number Variation of 10 Pyroptosis-Related Regulators in Breast Cancer
Figure 1 Landscape of genetic and transcriptomic variation of pyroptosis-related regulators in breast cancer. (A) 26 of the 986 BC patients experienced genetic alterations of 10 PRRs, with a frequency of 2.64%, mostly including missense mutation and nonsense mutation. (B) The CNV frequency of 10 PRRs was prevalent. The column represented the alteration frequency. The deletion frequency, green dot; The amplification frequency, pink dot. (C) PCA of 10 PRRs to distinguish BC from normal samples. (D) The difference of mRNA expression levels of 10 PRRs between BC and normal samples. The asterisks represented the statistical P-value (**P < 0.01; ***P < 0.001).
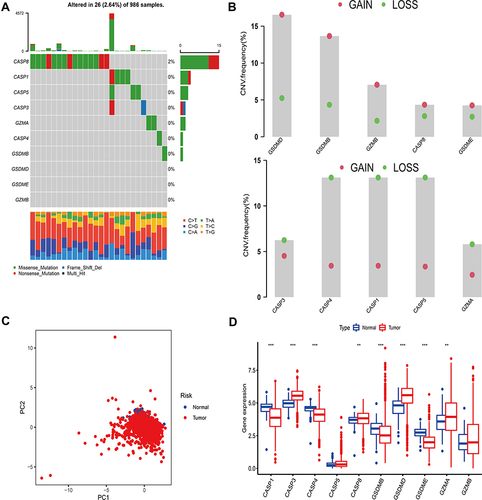
Figure 2 Tumor pattern clusters mediated by pyroptosis-related regulators. (A) The interaction of expression on 10 PRRs in BC. The lines connecting PRRs represented their interaction with each other. The size of each circle represented the prognosis effect of each regulator and scaled by P-value. Protective factors for patients’ survival were indicated by a green dot in the circle center and risk factors indicated by the purple dot in the circle center. (B) Kaplan–Meier curves of OS for 1834 BC patients in one meta cohort with different pyro-clusters. The numbers of patients in pyro-cluster A, B and C were 762, 688 and 384, respectively. (C) Unsupervised clustering of PRRs in one meta cohort. The pyro-cluster, gender, ER+, PR+, HER2+, phenotype, stage and survival status were used as patient annotations. Red represented the high expression of regulators and blue represented low expression.
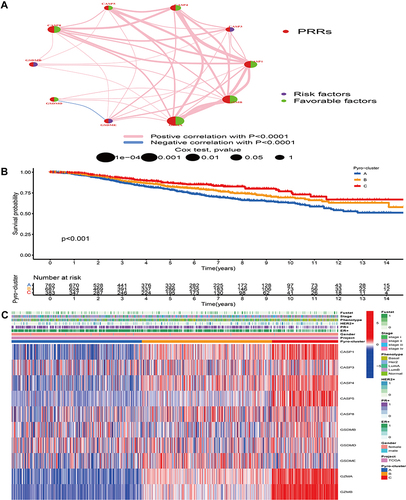
Figure 3 Biological pathway and tumor microenvironment characteristics in distinct pyro-clusters. (A–C) Heatmap showed the GSVA score of representative Hallmark pathways in distinct pyro-clusters. The TCGA-BRCA and GEO cohort (GSE20685, GSE20711, GSE42568, GSE58812, GSE88770) compositions were used as sample annotations. (D) Difference in the immune-activation related gene expression among three pyro-clusters. (E) The fraction of tumor-infiltrating cells in three pyro-clusters using the ssGSEA. Within each group, the scattered dots represented TME cell expression values. The thick line represented the median value. The bottom and top of the boxes were the 25th and 75th percentiles (interquartile range). The statistical difference of three pyro-clusters was compared through the Kruskal–Wallis H-test. (F) Difference in the TGF/beta-EMT pathway-related gene expression among three pyro-clusters. (G) Difference in the immune-checkpoint related gene expression among three pyro-clusters. (H) PCA of PRRs to distinguish between pyro-cluster A, B and C. ***P < 0.001, ns, not significant.
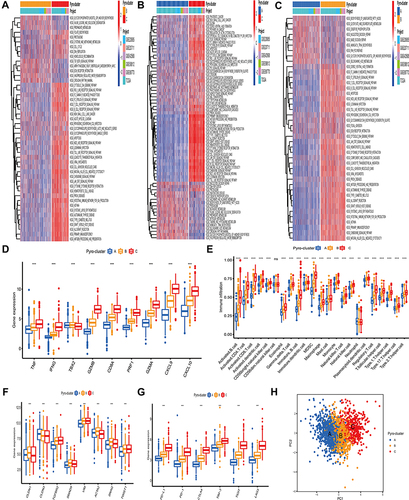
Figure 4 Construction of pyro-gene signature and functional annotation. (A) 2632 pyroptosis-related DEGs between three pyro-clusters were shown in the Venn diagram. (B and C) Functional annotation for pyroptosis-related signature genes using GO and KEGG enrichment analysis. (D) The expression of PRRs in three pyro-gene clusters. The upper and lower ends of the boxes represented an interquartile range of values. The lines in the boxes represented the median value. The asterisks represented the statistical P-value The one-way ANOVA test was used to test the statistical differences among three pyro-gene clusters. (E) The survival curves of the pyro-gene clusters were estimated by the Kaplan-Meier plotter (P <0.001). ***P < 0.001.
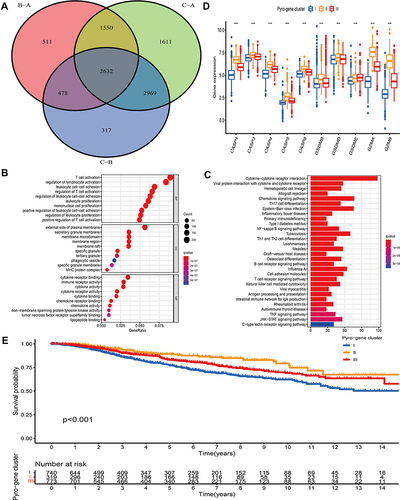
Figure 5 Construction of the pyroptosis-mediated prognostic model. (A and B) Ranked dot and scatter plots showing the risk score distribution and patient survival status. (C) Kaplan–Meier analysis of the OS between the two groups in the all, discovery and validation dataset, respectively. (D) ROC curves to predict the sensitivity and specificity of 1-, 3- and 5-year survival according to the prognostic model in the all, discovery and validation dataset, respectively.
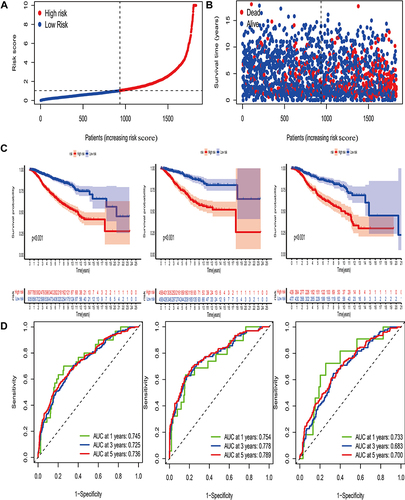
Figure 6 Construction of pyro-score and exploration of its clinical features. (A) Alluvial diagram of pyro-clusters in groups with different pyro-gene clusters, and pyro-score. (B) Distribution of pyro-score in the different pyro-clusters and pyro-gene clusters. (C) Correlations between pyro-score and the immune landscape using Spearman analysis. The negative correlation was marked with blue and positive correlation with red. The star signified the statistical difference (*P-value <0.05). (D) Kaplan–Meier curves for patients with high and low pyro-score subgroups. (E) Bar plot showing pyro-score in groups with ER+, PR+, HER2+, phenotypes. The differences between different groups were compared through the Kruskal–Wallis test.
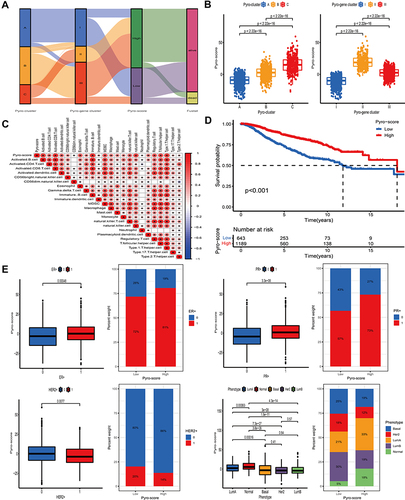
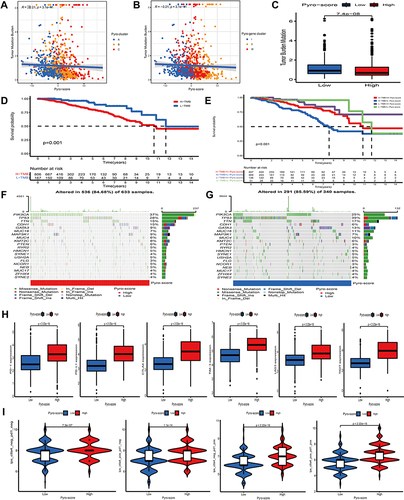
Figure 7 Characteristics of pyro-score in tumor somatic mutation and immunotherapies. (A and B) Correlation analysis between pyro-score and TMB. (C) Relative distribution of TMB in high versus low pyro-score group. (D) Kaplan–Meier curves for high and low TMB patient groups (P= 0.001). (E) Kaplan–Meier curves for subgroup patients stratified by both pyro-score and TMB (P< 0.001). (F and G) Mutational landscape of SMGs in TCGA-BRCA stratified by high (left panel) versus low pyro-score (right panel) groups. Individual patients were represented in each column. The upper bar plot showed TMB, the right bar plot showed the mutation frequency of each gene in separate pyro-score groups. (H) Relative distribution of immunosuppressive molecules expression in high pyro-score versus low pyro-score groups. (I) Relative distribution of immunotherapeutic efficacy in high pyro-score versus low pyro-score groups.