Figures & data
Figure 1 Identification of endothelial microparticles (EMPs). (A) Flowchart of EMPs isolation. (B) Transmission electron microscopy (TEM) of EMPs released from human pulmonary microvascular endothelial cells (HPMVECs), scale bar: 500nm; (C) Flow cytometry (FCM) of EMPs, standard fluorescent beads of 0.1µm and 1 µm were used to define the gate; (D) Western blotting for specific biomarkers of EMPs (PECAM, E-selectin and Annexin V).
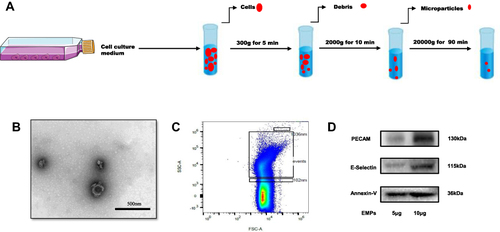
Figure 2 Effect of endothelial microparticles (EMPs) on cigarette smoke extract (CSE) induced inflammation in human bronchial epithelium cells (HBECs). (A) Treating diagram of EMPs from human pulmonary microvascular endothelial cells (HPMVECs) on HBECs; (B) Representative images of CFSE‐labeled EMPs merging with HBECs (green: CFSE; blue: DAPI), scale bar: 20µm; (C) Levels of TNF-α, IL-1β, and IL-6 mRNA in HBECs with RT-qPCR; (D) Western blotting analyses of NF-κB p65 and phosphorylated-NF-κB p65 (p-p65) in HBECs; (E) Statistical analysis for relative p-p65 protein level in HBECs; (F) Levels of TNF-α in the cell supernatant of HBECs with ELISA. (G) Levels of IL-1β in the cell supernatant of HBECs with ELISA. Data are presented as the mean ± SEM. *p<0.05 in comparison with control group, **p<0.01 in comparison with control group, ***p<0.001 in comparison with control group, #p<0.05 in comparison with CSE group, ##p<0.01 in comparison with CSE group, ###p<0.001 in comparison with CSE group.
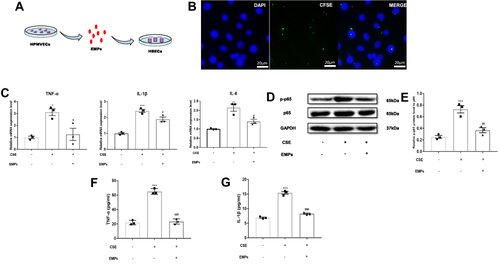
Figure 3 Effect of endothelial microparticles (EMPs) on pathological changes in COPD mice. (A) Treating diagram of EMPs from mouse pulmonary microvascular endothelial cells (MPMVECs) on COPD mice; (B) Pathological changes in mouse lung sections with hematoxylin and eosin (HE) staining; (C) Morphometric measurements of MLI (μm); (D) Morphometric measurements of DI (%); (E) Pathological changes in mouse airway with HE staining; (F) Lung inflammation scores in mice; (G) The number of total cells in mouse bronchoalveolar lavage fluid (BALF); (H) The number of neutrophils in mouse BALF; (I) The number of macrophages in mouse BALF. Data are presented as the mean ± SEM. **p<0.01 in comparison with control group, ***p<0.001 in comparison with control group, #p<0.05 in comparison with COPD group, ##p<0.01 in comparison with COPD group, ###p<0.001 in comparison with COPD group.
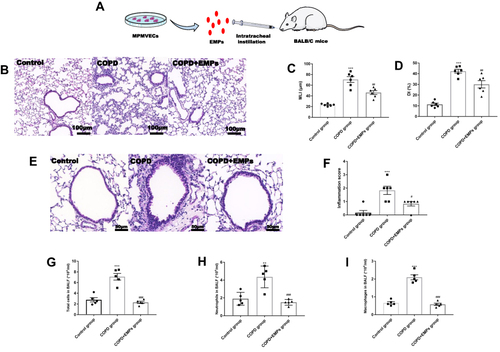
Figure 4 Effect of endothelial microparticles (EMPs) on lung inflammation in COPD mice. (A) Levels of TNF-α, IL-1β, and IL-6 mRNA in lung tissue with RT-qPCR; (B) Western blotting analyses of HMGB1 in lung tissue; (C) Statistical analysis for relative HMGB1 protein level in lung tissue; (D) Western blotting analyses of NF-κB p65 and phosphorylated-NF-κB p65 (p-p65) in lung tissue; (E) Statistical analysis for relative p-p65 protein level in lung tissue; (F) Immunohistochemistry (IHC) for HMGB1 in lung tissue; (G) Statistical analysis for average optical density (AOD) of HMGB1 in lung tissue; (H) Levels of TNF-α in mouse BALF with ELISA; (I) Levels of IL-1β in mouse BALF with ELISA. Data are presented as the mean ± SEM. **p<0.01 in comparison with control group, ***p<0.001 in comparison with control group, #p<0.05 in comparison with COPD group, ##p<0.01 in comparison with COPD group, ###p<0.001 in comparison with COPD group.
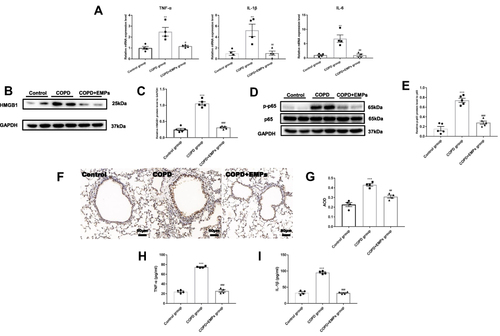
Figure 5 Effect of endothelial microparticles (EMPs)-derived microRNA-126 (miR-126) on cigarette smoke extract (CSE) induced inflammation in human bronchial epithelium cells (HBECs). (A) Treating diagram of EMPsmiR−126 on HBECs; (B) Effect of EMPsmiR−126mimic on miR-126 levels in HBECs with RT-qPCR; (C) Effect of EMPsmiR−126inhibitor on miR-126 levels in HBECs with RT-qPCR; (D) Effect of EMPsmiR−126mimic on relative HMGB1 protein level in HBECs with Western blotting; (E) Statistical analysis for the effect of EMPsmiR−126mimic on relative HMGB1 protein level in HBECs; (F) Effect of EMPsmiR−126mimic on relative phosphorylated-NF-κB p65 (p-p65) protein level in HBECs with Western blotting; (G) Statistical analysis for the effect of EMPsmiR−126mimic on relative p-p65 protein level in HBECs; (H) Effect of EMPsmiR−126inhibitor on relative HMGB1 protein level in HBECs with Western blotting; (I) Statistical analysis for the effect of EMPsmiR−126inhibitor on relative HMGB1 protein level in HBECs; (J) Effect of EMPsmiR−126inhibitor on relative p-p65 protein level in HBECs with Western blotting; (K) Statistical analysis for the effect of EMPsmiR−126inhibitor on relative p-p65 protein level in HBECs. EMPsmiR−126mimic represents EMPs transfected with miR-126 mimics; EMPsmiR−126inhibitor represents EMPs transfected with miR-126 inhibitors; EMPsmiR-NC represents EMPs transfected with miR-NC. Data are presented as the mean ± SEM. *p<0.05 in comparison with CSE group, **p<0.01 in comparison with CSE group, ***p<0.001 in comparison with CSE group, #p<0.05 in comparison with CSE+EMPs group, ##p<0.01 in comparison with CSE+EMPs group, ###p<0.001 in comparison with CSE+EMPs group, &p<0.05 in comparison with CSE+EMPsmiR-NC group, &&p<0.01 in comparison with CSE+EMPsmiR-NC group, &&&p<0.001 in comparison with CSE+EMPsmiR-NC group.
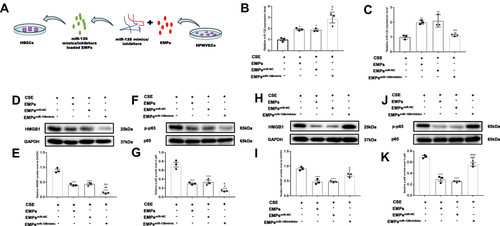
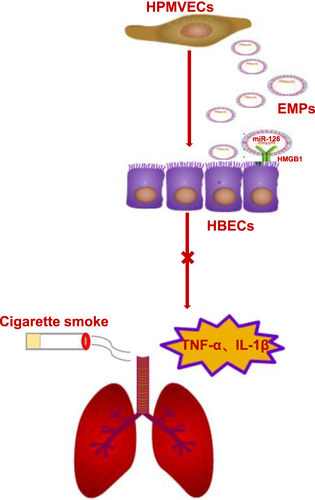
Figure 6 The mechanism diagram of summarized findings. HPMVECs-human pulmonary microvascular endothelial cells, EMPs-endothelial microparticles, HMGB1-high mobility group box 1, HBECs-human bronchial epithelium cells.