Figures & data
Table 1 Mouse Genotype Nomenclature and Expected Il1r1 Expression Patterns
Figure 1 4d LPS induces IL-1R1-dependent microglial morphologies and cytokine mRNA expression changes. (A) Experimental design of repeated LPS (4d LPS). On days 1 through 4 mice are injected daily with LPS (1 mg/kg, i.p.) or PBS. 24 hrs following the final i.p. injection mice were sacrificed for IHC, PCR, or FACS analysis. (B) Fluorescent immunolabeling of Iba-1 (green) following 4d PBS or 4d LPS in WT and Il1r1r/r mice. (C) Quantification of percent area of Iba-1 immunolabeling from WT and Il1r1r/r mice treated with 4d PBS or 4d LPS (n=4–5). (D) Representative images of individual Iba-1+ microglia overlaid with a thresholded mask and skeletonized structure by Cell Profiler 3.0. (E) Quantification of the branches from individual skeletonized microglia in both WT and Il1r1r/r mice treated with either 4d PBS or 4d LPS (n=50–90 individual microglia, n=4-5). (F) Quantification of the endpoints from individual skeletonized microglia in both WT and Il1r1r/r mice treated with either 4d PBS or 4d LPS (n=50–90 individual microglia, n=4–5). Quantification of the relative hippocampal tissue mRNA expression of IL-1β (G), TNFα (H), MSR1 (I) and YM-1 (J) from WT or Il1r1r/r animals treated with 4d PBS or 4d LPS (WT PBS n=7; WT LPS n=5; Il1r1r/r PBS n=6; Il1r1r/r LPS n=4). Scale bar = 100μm.Bars represented as mean ± standard error. Data denoted with asterisk (*) were determined as statistically significant from corresponding control group (P < 0.05), following F-protected post hoc test. *p < 0.05, ***P < 0.001.
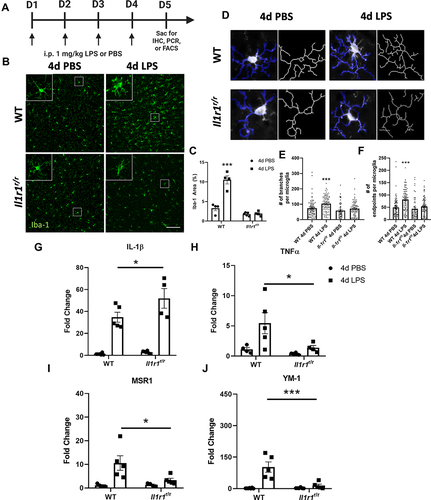
Figure 2 4d LPS drives cell-type specific changes in gene expression and IL-1R1-dependent microglia-vasculature interactions. Quantification of the relative mRNA expression of IL-1β (A), TNFα (A), YM-1 (B), MSR1 (B) and IL-1R1 (C) from FAC-sorted CD11b+CD45low microglia from WT mice treated with 4d LPS (n=4-5). (D) Representative immunofluorescent images of Iba-1 (green) and CD31 (red) 24 hrs following 4d PBS or 4d LPS in WT or Il1r1r/r mice. (E) Analysis of microglia morphological features including, cuffed, parenchymal, and cuffed clusters of microglia per field of view (FOV) in WT or Il1r1r/r following 4d PBS or 4d LPS (WT PBS n=4; WT LPS n=4; Il1r1r/r PBS n=4; Il1r1r/r LPS n=6). (F) Representative immunofluorescent images of CD31 (green), tdTomato (red), Iba-1 (Cyan) and merged channels from IL-1R1 reporter mouse, Il1r1GR/GR after 4d LPS. Yellow arrows denote microglia clustering on tdTomato+/CD31+ blood vessels. White arrow denote tdTomato−/CD31+ blood vessel without microglia clustering. Scale bar = 100 μm. Bars represented as mean ± standard error. Data denoted with asterisk (*) were determined as statistically significant from corresponding control group (P < 0.05) following F-protected post hoc test. *p < 0.05.
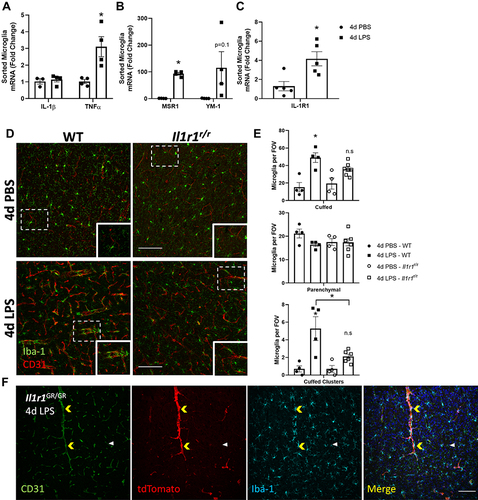
Figure 3 Endothelial IL-1R1 modulates microglial-vasculature interactions. Representative immunofluorescent images of Iba-1 (green) and CD31 (red) following 4d PBS or 4d LPS in Tie2-Cre-Il1r1r/r mice (A) or Cx3cr1-Cre-Il1r1r/r (F). Counts of cuffed, parenchymal, and clusters of cuffed microglia in Tie2-Cre-Il1r1r/r (B) or Cx3cr1-Cre-Il1r1r/r (G) following 4d PBS or 4d LPS (Tie2-Cre-Il1r1r/r n=4; Cx3cr1-Cre-Il1r1r/r n=3–4). Quantification of Iba-1% area in Tie2-Cre-Il1r1r/r (C) or Cx3cr1-Cre-Il1r1r/r (H) mice treated with 4d PBS or 4d LPS (Tie2-Cre-Il1r1r/r n=4; Cx3cr1-Cre-Il1r1r/r n=3–4). Representative images of individual Iba-1+ microglia overlaid with a thresholded mask and skeletonized structure by Cell Profiler 3.0 (D and I). Quantification of the branches and endpoints of individual skeletonized microglia from Tie2-Cre-Il1r1r/r (E) or Cx3cr1-Cre-Il1r1r/r (J) mice treated with 4d PBS or 4d LPS (Tie2-Cre-Il1r1r/r n=40 individual microglia, n=4-5 mice; Cx3cr1-Cre-Il1r1r/r n=30–70 individual microglia, n= 4–5. Quantification of the relative hippocampal tissue mRNA expression of IL-1β, TNFα, YM-1, and MSR1 from Tie2-Cre-Il1r1r/r (K) or Cx3cr1-Cre-Il1r1r/r (L) animals treated with 4d PBS vs 4d LPS (Tie2-Cre-Il1r1r/r n=4-5; Cx3cr1-Cre-Il1r1r/r n=4–5). Scale bar = 100μm. Bars represented as mean ± standard error. Data denoted with asterisk (*) were determined as statistically significant from corresponding control group (P < 0.05) following F-protected post hoc test. *p < 0.05, **p < 0.01, ***P < 0.001.
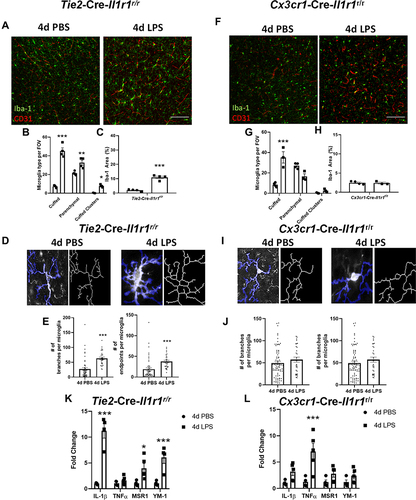
Figure 4 4d LPS induces functional IL-1R1 on microglia. (A) Quantification of the relative mRNA expression of IL-1R1 from Cx3cr1-Cre-Il1r1r/r treated mice for 4d PBS or 4d LPS (n=3). (B) Experimental design of 4d LPS plus i.c.v. IL-1 challenge. On days 1 through 4, mice are injected i.p. with 1mg/kg LPS or PBS. 24 hours following the final i.p. injection, mice were injected with IL-1β (20 ng, i.c.v) and sacrificed 24 hrs after for IHC and PCR analysis. (C) Representative images of fluorescent immunolabeling of Iba-1 (green) following 4d PBS or 4d LPS followed by i.c.v. IL-1 or PBS in Cx3cr1-Cre-Il1r1r/r mice. Relative hippocampal tissue mRNA expression of IL-1β, TNFα and IL-1RA in Cx3cr1-Cre-Il1r1r/r (D–F) or Lysm-Cre-Il1r1r/r (G–I) animals treated with 4d PBS vs 4d LPS followed by i.c.v PBS or IL-1 (Cx3cr1-Cre-Il1r1r/r n=4-5; Lysm-Cre-Il1r1r/r n=3-5). Scale bar = 100μm. Bars represented as mean ± standard error. Data denoted with asterisk (*) were determined as statistically significant from corresponding control group (P < 0.05) following F-protected post hoc test. *p < 0.05, ***P < 0.001 from PBS treated controls.
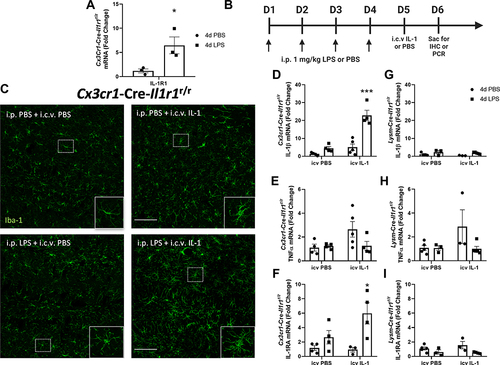
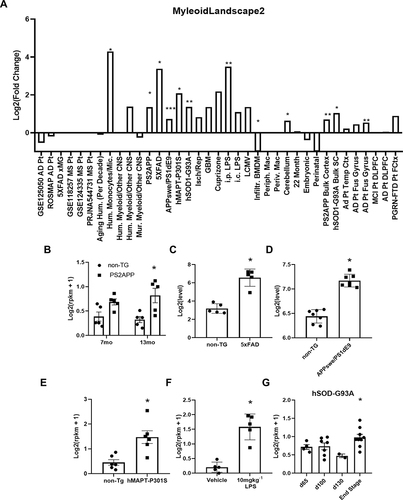
Figure 5 Microglial IL-1R1 induction is found in neurodegenerative diseases and following peripheral infections. (A) RNA sequencing analysis from Friedman et al, 2018 of microglia-specific Il1r1 log transformed differential gene expression in models of neurodegenerative disease, infection, and human disease. Differential gene expression of Il1r1 in FACS sorted brain microglia from (B) 7 month or 13 month non-transgenic or PS2APP mice (n=5), (C) 8.5 month old non-transgenic or 5xFAD mice (n=5), (D) 15–18 month old non-transgenic or APPswe/PS1dE9 mice (n=7), (E) non-transgenic or hMAPT-P301S mice or (F) 6 hrs following i.p. injection of vehicle or 10 mgkg−Citation1 LPS (n=5). (G) Differential gene expression of Il1r1 mRNA in FAC-sorted spinal cord microglia (CD11b, CD86, CD11c cells) in hSOD-G93A model of ALS at 65d, 100d, 130d and end stage. Bars represented as mean ± standard error, *p < 0.05, **p < 0.01, ***P < 0.001 from corresponding controls.