Figures & data
Figure 1 Illustration of herb-partitioned moxibustion. HPM treatment was administered by placing a moxa cone on the top of an herbal cake at the Tianshu (ST25, bilateral) and Qihai (CV6) points and igniting it.
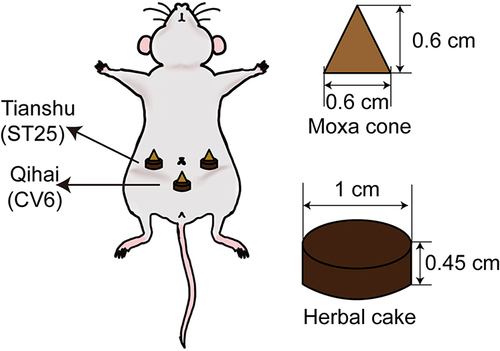
Figure 2 CMDIs, colon length and morphological observation. (A) CMDIs. (B) Colon length. (C) Colon images. (D–F) Morphological observation with hematoxylin and eosin (H&E) staining. Data are presented as the median (P25, P75) in (A) and mean ± SD in (B). *P < 0.05, **P < 0.01, ***P<0.001. The black arrow indicates the location of the ulcer. Scale bar: 100 µm, n = 8.
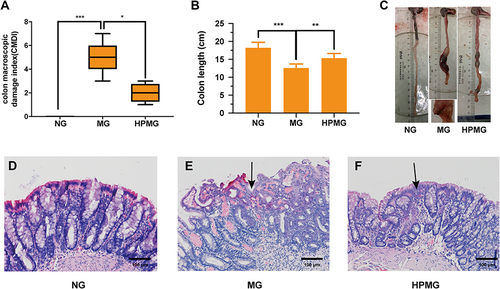
Figure 3 The DE lncRNAs were analyzed based on the RNA sequencing data in MG and NG. (A) Volcano plot and (B) heatmap of DE lncRNAs between MG and NG (log2FC >1 and P<0.05). (C) Top 30 GO terms from the genes enrichment analysis and (D) top 20 significant KEGG pathways between MG and NG.
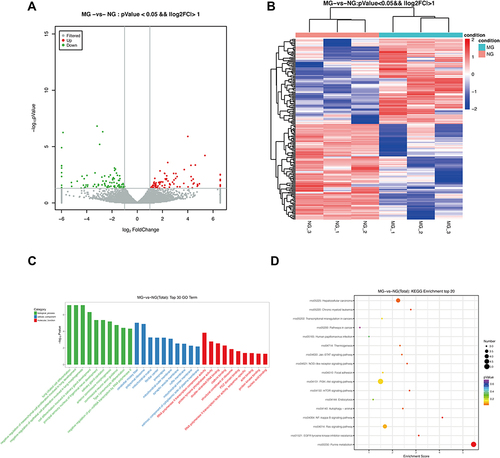
Figure 4 The DE lncRNAs were analyzed based on the RNA sequencing data in HPMG and MG. (A) Volcano plot and (B) heatmap of DE lncRNAs between HPMG and MG (log2FC >1 and P<0.05). (C) Top 30 GO terms from the genes enrichment analysis and (D) top 20 significant KEGG pathways between HPMG and MG.
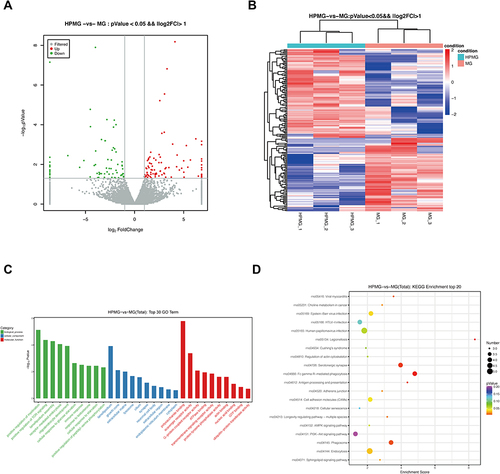
Figure 5 The DE miRNAs and mRNAs were analyzed based on the small RNA and RNA sequencing data. (A) Volcano plot and (B) heatmap of DE miRNAs between MG and NG (log2FC >1 and P<0.05). (C) Volcano plot and (D) heatmap of DE miRNAs between HPMG and MG (log2FC >1 and P<0.05). (E) Volcano plot and (F) heatmap of DE mRNAs between MG and NG (log2FC >0.58 and P<0.05). (G) Volcano plot and (H) heatmap of DE mRNAs between HPMG and MG (log2FC >0.58 and P<0.05).
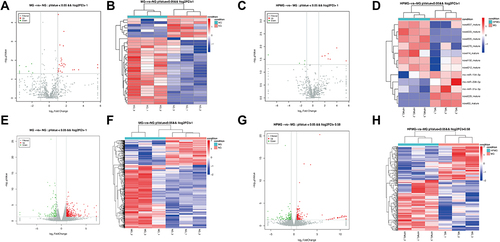
Figure 6 LncRNA-miRNA-mRNA network analysis. Green, red and purple represent lncRNAs, miRNAs and mRNAs, respectively.
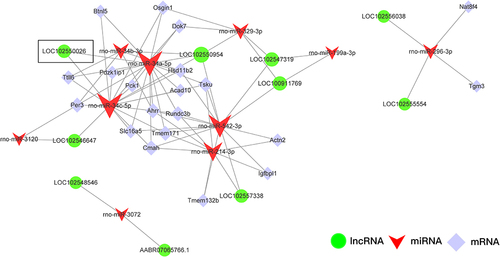
Figure 7 Functional analysis of ceRNA network. (A) Top 10 GO terms of mRNAs in ceRNA networks. (B) Top 30 significant KEGG pathways of mRNAs in ceRNA networks. (C) PPI network construction for mRNA in ceRNA network. The value of centrality degree is marked by different node size. Up or down regulation of genes is filled with red or blue color, respectively.
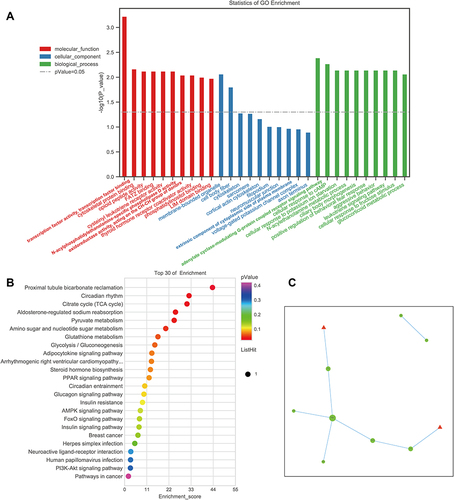
Figure 8 Validations of the selected DE RNA expression. (A and B) The key lncRNAs expressions of LOC102550026 and LOC102557338 were measured by qRT-PCR (n = 6). (C) The core lncRNA-miRNA-mRNA network analysis. (D and E) The expressions of miRNA-34a-5p and miRNA-34c-5p were measured by qRT-PCR (n = 6). (F–J) The mRNA expressions of Pck1, pdzklip1, Acad10, Btnl5 and Rundc3b were measured by qRT-PCR (n = 6). (K) The targeting relationship between lncRNA-LOC102550026 and miRNA-34c-5p was predicted. (L) The targeting relationship between miRNA-34c-5p and Pck1 was predicted. (M and N) Western blot analysis of Pck1 protein in colon homogenate in each group. Data are expressed as mean ± standard deviation. *p < 0.05, **p < 0.01, ***p < 0.001.
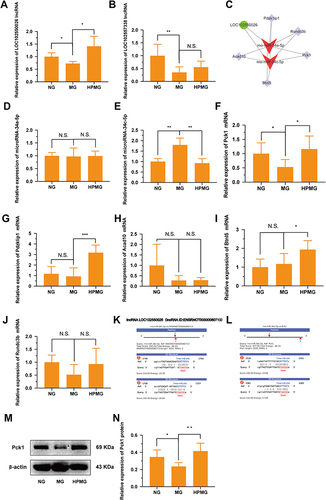
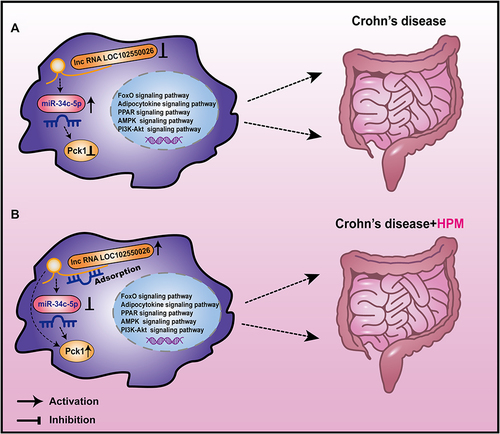
Figure 9 Schematic diagram illustrating the mechanism. LncRNA LOC102550026/miRNA-34c-5p/Pck1 axis and adipocytokine, PPAR, AMPK, FoxO and PI3K-Akt signaling pathways may regulate the intestinal immune inflammatory response (A), and HPM may regulate the lncRNA LOC102550026/miRNA-34c-5p/Pck1 axis and adipocytokine, PPAR, AMPK, FoxO and PI3K-Akt signaling pathways to improve intestinal inflammation in CD (B).