Figures & data
Figure 1 General scheme for the synthesis of new benzimidazole acetamide derivatives. (A) N-[4-(2-phenyl-1H-benzimidazole-1-sulfonyl) phenyl] acetamide (Ca) (B) and N-{4-[2-(2-methoxyphenyl)-1H-benzimidazole-1 sulfonyl] phenyl} acetamide (Cb).
![Figure 1 General scheme for the synthesis of new benzimidazole acetamide derivatives. (A) N-[4-(2-phenyl-1H-benzimidazole-1-sulfonyl) phenyl] acetamide (Ca) (B) and N-{4-[2-(2-methoxyphenyl)-1H-benzimidazole-1 sulfonyl] phenyl} acetamide (Cb).](/cms/asset/cf4de40a-cea0-4c7f-8f5c-484da59936a4/djir_a_12153867_f0001_c.jpg)
Table 1 Grid Formation for Molecular Docking
Figure 2 Experimental design.
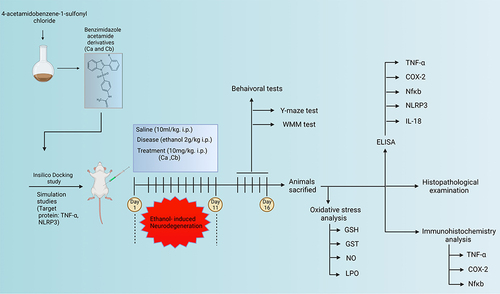
Table 2 Best Pose Dock Analysis, Showing Atomic Contact Energy Values (kcal/nol) Formed by the Interaction of Ca, Cb, and Donepezil Against TNF-α, COX-2, NLRP3, and IL-18
Table 3 Best Pose Dock Analysis, Showing the Number of Hydrogen Bonds Formed by the Interaction of Ca, Cb, and Donepezil with TNF-α, COX-2, NLRP3, and IL-18
Figure 3 Docked poses of protein TNF-α (A), COX2 (B), NLRP3 (C), and IL-18 (D) with co-crystallized ligands Ca and Cb. Panel 1a, 2a, 3a, and 1b, 2b, 3b, and 1c, 2c, 3c, and 1d, 2d, 3d represent 2D interactions of Ca, Cb, and donepezil respectively with TNF-α, COX2, NLRP3, and IL-18. Panel 4a, 5a, 6a, and 4b, 5b, 6b, and 4c, 5c, 6c, and 4d, 5d, 6d represent 3D interactions of Ca, Cb, and donepezil respectively with TNF-α, COX2, NLRP3, and IL-18. Panel 7a, 8a, 9a, and 7b, 8b, 9b, and 7c, 8c, 9c, and 7d, 8d, 9d represent the best pose of the complex.
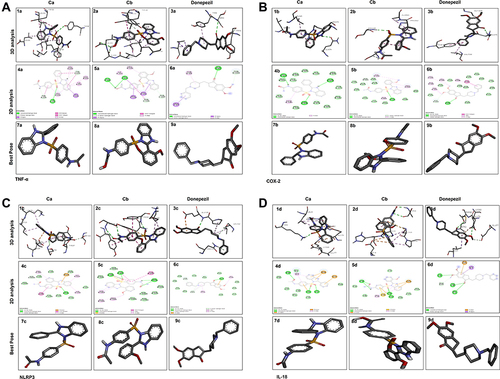
Figure 4 Representative RMSD panels of the Ca, Cb, and donepezil target protein TNF-α and NLRP3 over different nanoscale times. The left and the right y-axis indicated a change in the RMSD value of the target protein and ligand respectively over different nanoscale times. (A) Ca-TNF-α complex, (B) Ca-NLRP3 complex, (C) Cb-TNF-α complex, (D) Cb-NLRP3 complex, (E) DNP-TNF-α complex, (F) DNP-NLRP3 complex.
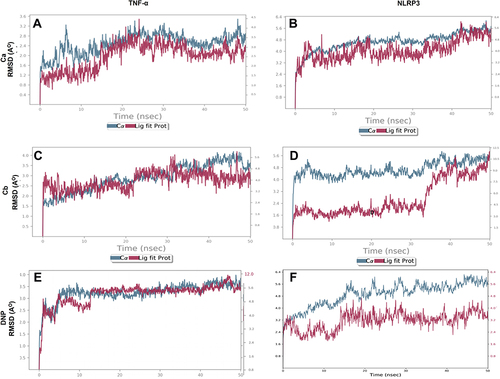
Figure 5 Representation of RMSF for the Ca, Cb, and DNP using the Desmond software package. (A) Ca-TNF-α complex, (B) Ca-NLRP3 complex, (C) Cb-TNF-α complex, (D) Cb-NLRP3 complex, (E) DNP-TNF-α complex, (F) DNP-NLRP3.
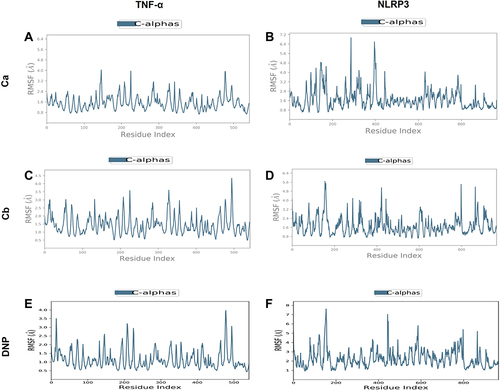
Figure 6 Interactions of drugs with receptor proteins. (A) Ca-TNF-α complex, (B) Cb-TNF-α complex, (C) DNP-TNF-α complex, (D) Cb-TNF-α complex, (E) Cb-NLRP3 complex, (F) DNP-NLRP3 complex.
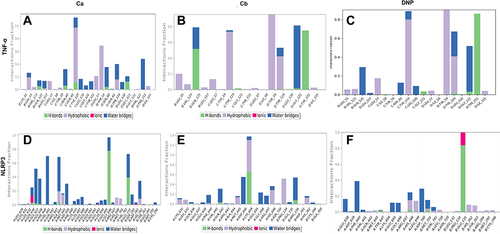
Figure 7 Timeline representation of the interactions and contacts (H-bonds, hydrophobic, ionic, and water bridges) the top panel of each image shows the total number of specific contacts the protein makes with the ligand throughout the trajectory. The bottom panel of each image shows which residues interact with the ligand in each trajectory frame. (A) Ca-TNF-α comple,x (B) Cb-TNF-α complex, (C) DNP-TNF-α complex, (D) Cb-TNF-α complex, (E) Cb-NLRP3 complex, (F) DNP-NLRP3 complex.
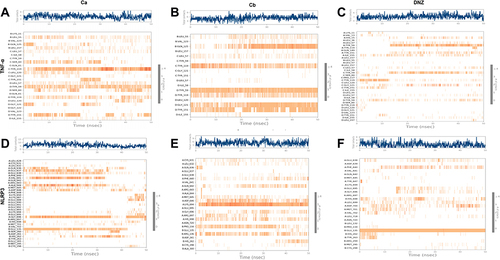
Figure 8 Effect of Ca and Cb on ethanol-induced memory impairment and neuronal survival. (A) The latency time of rats on the hidden platform. (B) Time spent by ethanol and drug-treated rats in each quadrant in the probe test on the 4th day. (C) The percentage time spent by animals in the target quadrant, with 10/group. (D) Effect of ethanol and drugs on alteration behavior. (E) Representative photomicrographs of the H&E-stained cortex and hippocampal tissue revealing the presence of kryolitic and atrophied nuclei in ethanol-treated animals while the Ca, Cb, and donepezil group showed only a few cells with degenerative signs (40×, scale bar 50 μm). All data were expressed as mean ± SEM (n=5/group). Data are expressed as mean ± SEM. $$p<0.01 compared to the saline group, €Shows a significant difference relative to the ethanol group denotes a significant difference compared with the saline group$$.
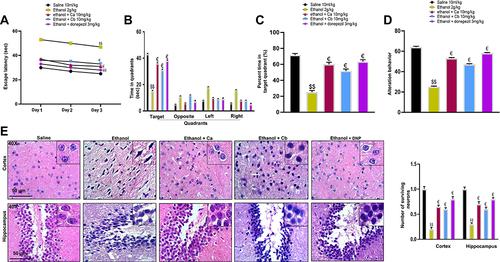
Figure 9 Effect of Ca, Cb, and donepezil on oxidative enzymes in the cortex and hippocampus. (A) GSH level, (B) GST level, (C) LPO level, (D) NOS level. Data are expressed as mean ± SEM. $$p<0.01 compared to the saline group while €p<0.05 compared to the LPS group. €Shows a significant difference relative to the ethanol group All data were expressed as mean ± SEM (n=5/group).
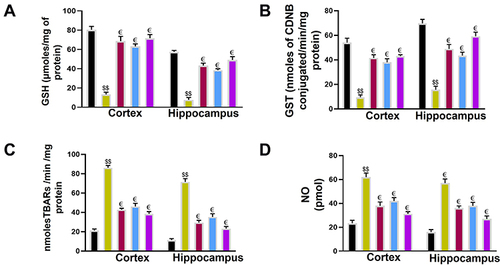
Figure 10 Effect of test compounds on the outcomes of ethanol-induced inflammatory mediators. (A) p-NFκB protein expression as quantified by ELISA with (n=5/group). (B) Immunohistochemistry results for p-NFκB in the cortical and hippocampal tissues with (n=5/group). p-NF-ΚB exhibited nucleus localization in the treated tissue. (C) TNF-α protein expression as quantified by ELISA with (n=5/group). (D) Immunohistochemistry results for TNF-α in the cortical and hippocampal tissues with (n=5/group). TNF-α exhibited cytoplasmic localization in treated brain tissues. (E) COX2 protein expression as quantified by ELISA with (n=5/group). (F) Immunohistochemistry results for COX2 in the cortical and hippocampal tissues with (n=5/group). (G) NLRP3 protein expression as by ELISA (H) IL-18 protein expression as by ELISA with (n=5/group). Data are expressed as mean ± SEM. $$p<0.01 compared to the saline group, €Shows a significant difference relative to the ethanol group denotes a significant difference compared with the saline group.
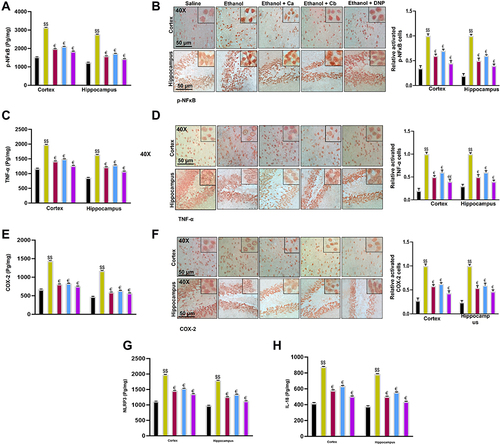
Figure 11 Western blot analysis of IL-1β and Caspase 1. Data are expressed as mean ± SEM. $$p<0.01, $$p<0.01 compared to the saline group while €€p<0.05 compared to the LPS group.
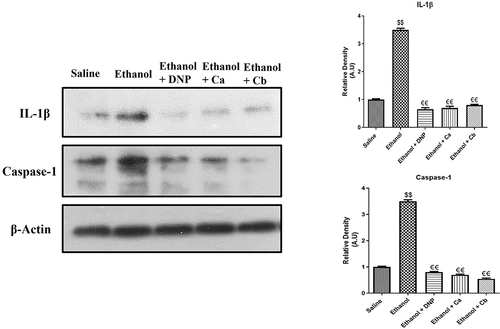
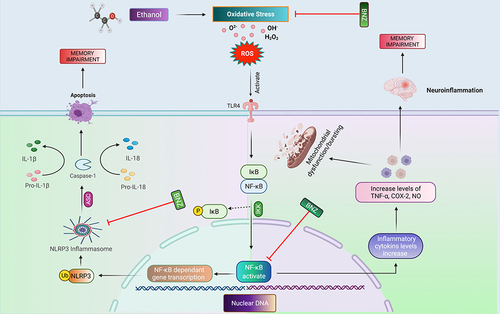
Figure 12 Diagrammatic illustration elaborating the underlying antioxidant and neuroprotective potential of Ca and Cb in ethanol-induced memory impairment model.