
Figures & data
Table 1 Demographic Information of the IBD Patients
Figure 1 Lesion locations of inflammatory bowel diseases. (A) Ulcerative disease. E1: Rectus, E2: left-colon; E3: pan-colon. (B) Crohn’s disease. L1: ileum, L2: colon; L3: ileo-colon, L4: isolated upper gastric tract.
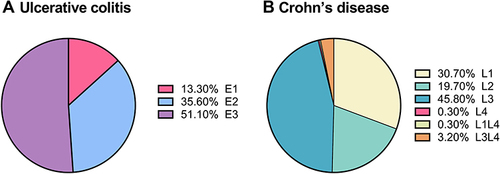
Table 2 Comparison of Symptoms and Complications
Figure 2 Endoscopic and pathologic features of IBD. (A and C) Endoscopic (A) and histopathologic (C) appearance of Crohn’s disease. (B and D) Endoscopic (B) and histopathologic (D) appearance of ulcerative colitis. Magnification of C and D x 100.
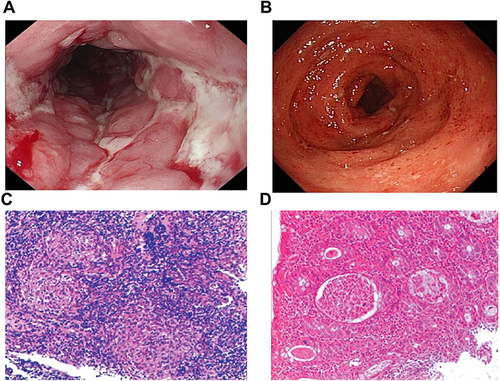
Table 3 Parameters of Laboratory Test in Ulcerative Colitis at Various Activity Status
Table 4 Parameters of Laboratory Test in Crohn’s Disease at Various Activity Status
Table 5 Sensitivity and Specificity of the Parameters on Evaluating Ulcerative Colitis Activity Status by ROC Curve Analysis
Figure 3 Receiver-operating characteristic (ROC) analysis of ESR, CRP and platelet counts for evaluating IBD. (A) ROC curve of ESR, CRP and platelet for evaluating UC. (B) ROC curve of ESR, CRP and platelet for evaluating CD.
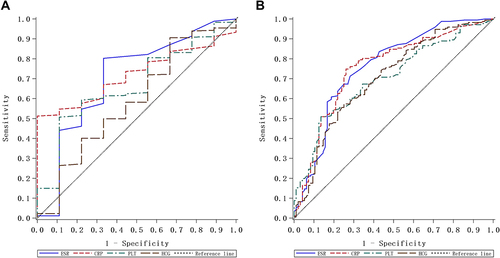
Table 6 Sensitivity and Specificity of the Parameters on Evaluating Crohn’s Disease Activity Status by ROC Curve Analysis
Table 7 Positivity of Antibodies Against Various Antigens in Ulcerative Colitis and Crohn’s Disease
Table 8 Summary of the Treatment for Ulcerative Colitis and Crohn’s Disease