Figures & data
Figure 1 Comparison of HT incidence between males and females with different metabolic status and obesity defined by BMI. ***:p<0.001.
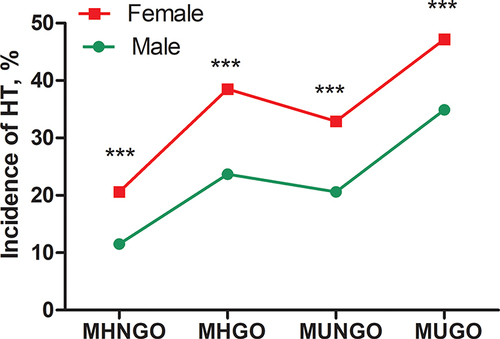
Figure 2 Comparison of HT incidence between males and females with different metabolic status and obesity defined by WC. ***:p<0.001.
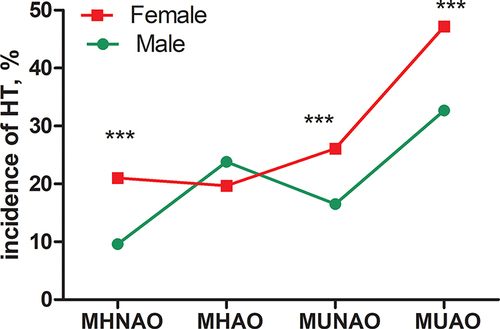
Table 1 Baseline Characteristics of All Subjects According to HT by Gender
Table 2 Association Between Metabolic Obesity Phenotypes and the Risk of HT Separately in Males and Females
Table 3 Test for Linear Trend for Association Between BMI Categories and Quartiles of WC with HT Risk
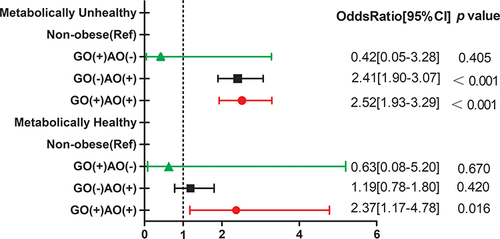
Figure 3 Association between different obesity types with HT risk in metabolically healthy and unhealthy states.