
Figures & data
Figure 1 Study design and distribution of ΔPO2/FiO2 for all included patients. (A) Schematic diagram of study design. (B) Distribution of ΔPO2/FiO2 of all included patients.
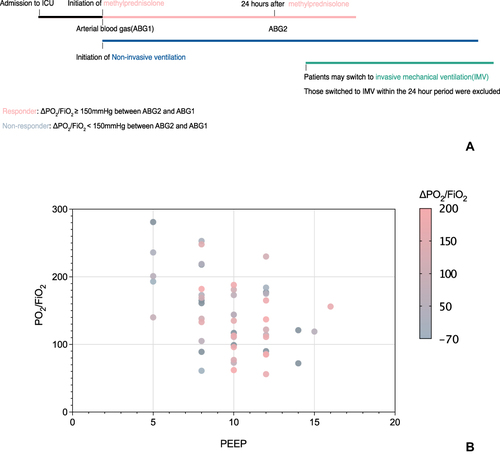
Table 1 Characteristics of Corticosteroid Non-Responders and Responders
Figure 2 Alpha diversity and beta diversity of lung microbiota for the non-responders and responders. (A and B) The non-responders and responders had no difference in the richness of species (evaluated with ACE index and chao1 index). (C and D) The responders had lower diversity in lung microbiota than the non-responders (evaluated with Shannon index and Simpson index). (E) The beta diversity was evaluated with Bray-Curtis Dissimilarity metric plotted in a principal coordinate analysis (PCoA), revealing an apparent pattern of clustering.
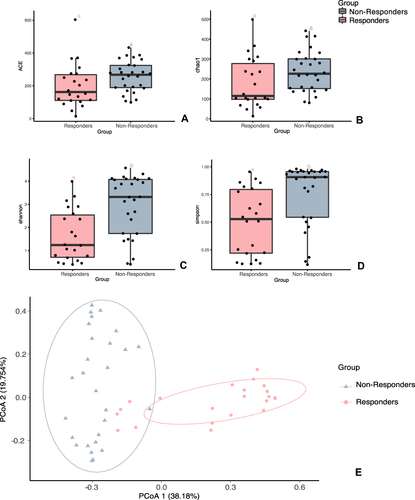
Figure 3 Constitution of microorganisms in the lung microbiota of non-responders and responders. (A) The relative abundance of top 20 families in the BAL samples of included patients. (B) The relative abundances of the top 20 families within the groups of non-responders and responders.
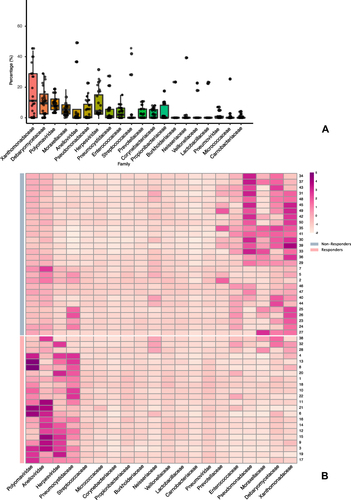
Figure 4 Taxonomic difference of lung microbiota in non-responders and responders. (A) Cladogram using the LEfSe method indicating the phylogenetic distribution of lung microbiota of non-responders and responders, only the units with difference s were presented. (B) LDA effect size analysis revealed significant microbial differences in the two groups. LDA score (log10 >2) and p< 0.05 are presented.
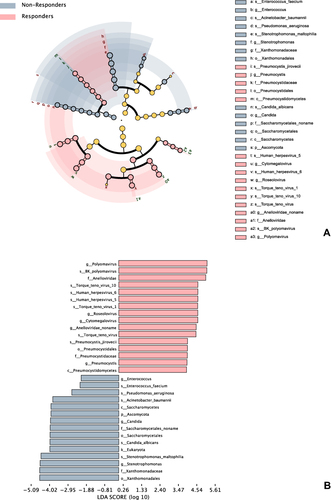
Figure 5 The etiological microbiome, clinical course and outcomes of non-responders and responders. (A) The primary and secondary etiological species of non-responders and responders. (B) Clinical courses of non-responders and responders. (C) The Kaplan-Meier survival curve of non-responders and responders (Log-rank p = 0.073). (D) The Kaplan-Meier survival curve of non-responders with or without coinfection and responders (Log-rank p = 0.028).
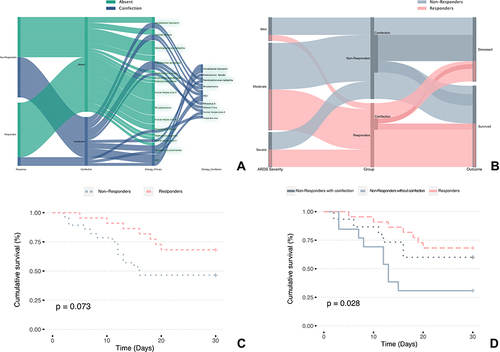
Table 2 Outcomes of Corticosteroid Non-Responders and Responders