Figures & data
Table 1 Matrix of Outcome Measures and Assessments
Table 2 Univariate and Multivariate Logistic Regression Between CACS and Hemogram Indices
Figure 1 Analysis of the predictive effect of different clinical indicators and scores on CAC score. (A) Representative examples of CAC in four patients. (B) ROC shows the predictive ability of SUA in asymptomatic participants. (C) The column diagram shows the correlation between four items in CACS and SUA. (D) ROC shows the predictive ability of the Framingham risk score in asymptomatic participants; (E) ROC shows the predictive ability of ESR in asymptomatic participants.
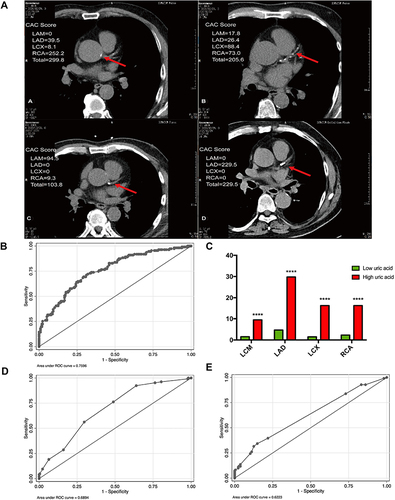
Figure 2 A total of 326 asymptomatic middle-aged and elderly patients with 5-year clinical follow-up analysis. (A) Survival curve in 326 asymptomatic middle-aged and elderly patients over five years. K-M analysis demonstrated that SUA level was associated with CACS. P<0.05 means statistically significance between two groups. (B) Binary cox regression analysis for CACS within 5 years. Forest plot showed the result of cox regression analysis.
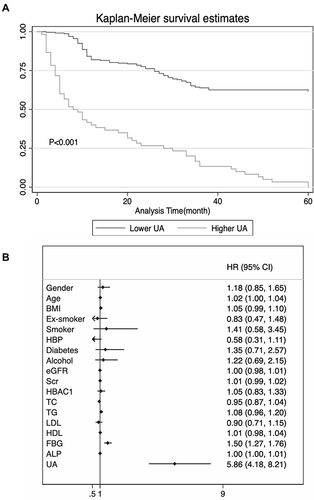
Figure 3 Potential pathogenesis of hyperuricemia on coronary atherosclerosis. (A) The Venn diagram of both hyperuricemia targets and coronary atherosclerosis targets. (B) Bubble chart of the top 9 signaling pathways screened by using the KEGG enrichment analysis. (C) Protein-protein interaction and gene co-expression network. (D) Hub genes were determined using the STRING and Cytoscape software. (E) Venn diagram showing the overlap genes between three types of pathways. (F) Protein-protein interaction and gene co-expression network.
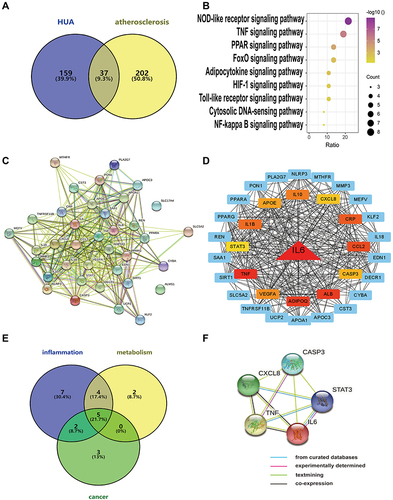
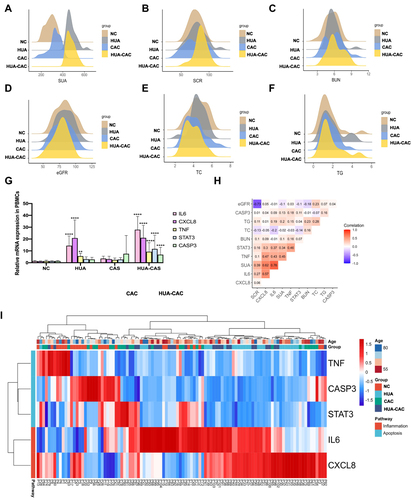
Figure 4 An observational study on 104 asymptomatic middle-aged and elderly patients. (A-F) Density distribution of SUA, SCR, BUN, eGFR, TC and TG value in four groups. (G) Column plot shows the mRNA level of five genes (IL-6, CXCL8, TNF, Caspase3, STAT3) between four groups. (H) The correlation analysis between clinical indexes and relative gene expression in patients. (I) Expression profile cluster analysis of five genes from PBMCs involved in four groups patients.