Figures & data
Figure 1 MULT1 encoding DNA injection alleviates egg granuloma and hepatic fibrosis in mice infected with Schistosoma japonicum. (A) Experimental design. Briefly, 6-week-old BALB/c female mice (n=6 per group) were artificially infected with S. japonicum by cutaneous contact with 24 cercariae on a wet cover slip. Administration of 40 μg rMULT1 DNA or vehicle DNA was carried out via hydrodynamic tail vein injection; the process was initialized at 4 weeks post infection and repeated 3 times in 1 month before the mice were anaesthetized and sacrificed at the end point. (B) RT-qPCR data and (C) sandwich fluorescence immunoassay showing elevated MULT1 expression in p-rMULT1-injected mice compared with control group mice (GFP-ctl) administered vehicle plasmids. (D) Representative H&E staining images (left panel, magnification x200) and quantification of mean (±SEM) egg-induced granuloma size in the liver (white circles). (E) Representative Masson’s trichrome staining images (left panel, magnification x200) and quantification of mean (±SEM) collagen deposition (right panel). (F and G) RT-qPCR showing decrease of (F) liver collagen I and (G) α-SMA expression. Western blotting assay demonstrating reduced protein concentration of (H and I) collagen I, (H and J) α-SMA and (H and K) TGF-β in the livers of mice administered rMULT1 DNA. Data are representative of 4–6 animals per subgroup and 3 independent experiments. Comparisons were between rMULT1 and GFP-ctl, *P<0.05 and **P<0.01.
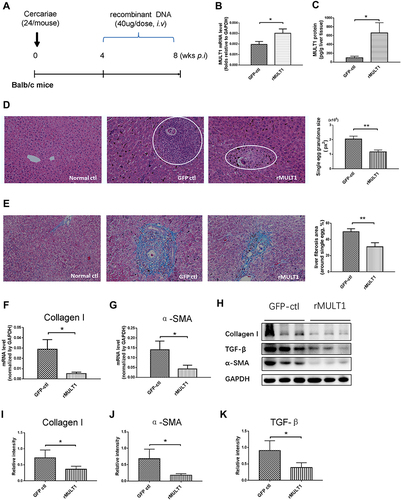
Figure 2 Cytokine levels in the serum and liver. (A) Cytometric bead array analysis showing similar levels of several serum cytokines between treated mice and GFP-ctl mice, including IFN-γ, IL-2, IL-17, IL-6, TNF-α and IL-4. (B) Reverse transcription-quantitative PCR showing increased IFN-γ, decreased IL-10 and similar TGF-β RNA levels in liver of the rMULT1 group relative to the GFP-ctl group. (C) Cytometric bead array analysis of liver tissue showing elevated IFN-γ, unchanged IL-2, IL-17, IL-6, TNF-α and IL-4 in treated group. Comparisons were between rMULT1 and GFP-ctl, *P<0.05.
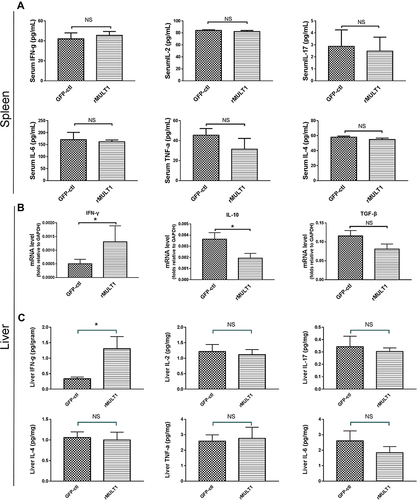
Figure 3 Decreased CD4+ T, CD8+ T, NK and NKP46+ NKT cell percentages in the spleen and the liver of BALB/c mouse with chronic S. japonicum infection. BALB/c female mice aged 6 weeks were artificially infected with 24 cercariae of S. japonicum or served as the healthy control with a mock infection procedure, then without any treatment, mice were euthanized and data were collected at 8 weeks post infection. (A and C) Representative dot plot graphs and (B and D) summary data demonstrated a significantly decreased percentage of NK cells, NKP46+ NKT cells, CD8+ T cells and CD4+ T cells in (A and B) splenocytes and (C and D) liver infiltrating lymphocytes of mice. Data are representative of 4–6 animals per subgroup and 3 independent experiments. Comparisons were between Infected and NC. *P<0.05 and ***P<0.001.
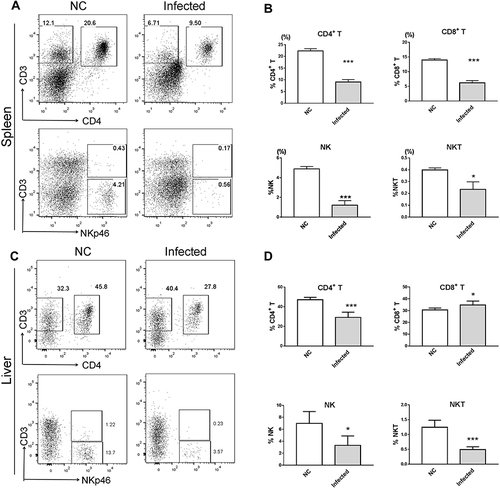
Figure 4 rMULT1 DNA restores lymphocyte percentages in the spleens and livers of S. japonicum-infected mice. (A and C) Representative dot plot graphs and (B and D) data demonstrated a significantly increased portion of NK cells, NKP46+ NKT cells, CD8+ T cells in spleen and of NK cells, CD4+ T cells in liver but not of CD4+ T cells in spleen or NKT cell in liver, as well as a significantly decreased portion of CD8+ T in liver, of mice that received rMULT1 DNA treatment. Data are representative of 4–6 animals per subgroup and 3 independent experiments. Comparisons were between rMULT1 and GFP-ctl, *P<0.05 and **P<0.01.
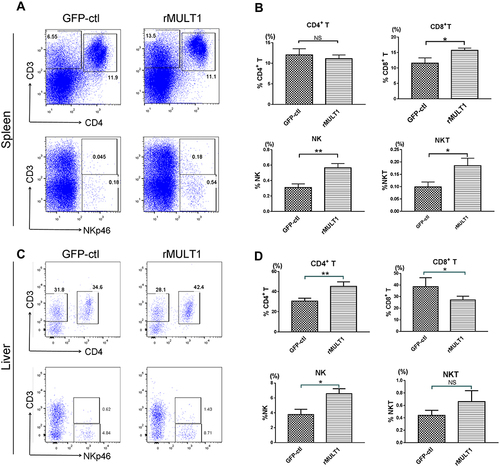
Figure 5 NK cell phenotype changes due to infection. Long term S. japonicum infection downregulated (A and G) NKG2D, (B and H) KLRG1 and (D and J) CD49b and (E, F, K and L) IFN-γ expression and elevated (C and I) CD69 level on NK cell surface. Open line, health control; filled grey line, infected in all representative histograms. Data are representative of 4–6 animals per subgroup and 3 independent experiments. Comparisons were between Infected and NC. *P<0.05, **P<0.01, ***P<0.001 and ****P<0.0001.
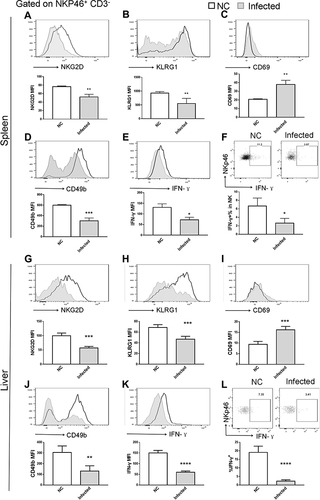
Figure 6 NK cell phenotype changes were restored by rMULT1 DNA treatment. NK cells form rMULT1 group showed increased (A and G) NKG2D, (B and H) KLRG1, (D and J) CD49b and decreased (C and I) CD69, as well as enhanced (E, F, K and L) IFN-γ secretion, compared to those from GFP-ctl group. Open red line, rMULT1 group; filled green line, GFP-ctl group in all representative histograms. Data are representative of 4–6 animals per subgroup and 3 independent experiments. Comparisons were between rMULT1 and GFP-ctl, *P<0.05 and **P<0.01.
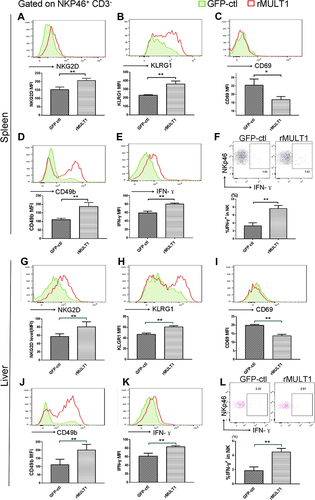
Figure 7 Impact of S. japonicum infection on splenic T-cell phenotype at the end of the 8th week post S. japonicum infection. Flow cytometry assay of (A-E) CD8+ T cells and (F-K) CD4+ T cells. Data demonstrated (A and F) suppressed NKG2D expression on CD8+ T cells, but not on CD4+ T cells from treated mice. Infected mice exhibited lower CD62L and lower CD27 expression both on (G and I) CD4+ T and (B and D) CD8+ T cells compared with control mice. (C and H) CD8+ T cells, but not CD4+ T cells, exhibited downregulated surface expression of KLRG1 upon S. japonicum infection, while (E and J) CD4+ T cells, but not CD8+ T cells, exhibited decreased IFN-γ secretion in the infected mice. (K) Combined staining of CD4+ T cells with intracellular IFN-γ and IL-4 demonstrated a significant decrease of the Th1/Th2 ratio in the CD4+ T cells of the infected mice. Open line, health control; filled grey line, infected in all representative histograms. Data are representative of 4–6 animals per subgroup and 3 independent experiments. Comparisons were between Infected and NC. *P<0.05 and **P<0.01.
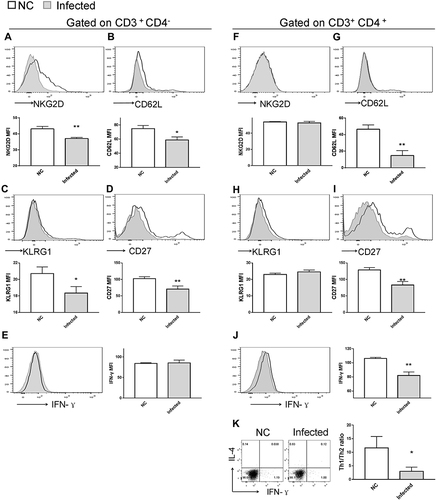
Figure 8 Impact of rMULT1 DNA treatment on splenic T-cell phenotype in mice with S. japonicum infection. Flow cytometry data demonstrated an elevated NKG2D expression on (A) CD8+ T cells but not on (F) CD4+ T cells from treated mice. (G) The treated group exhibited decreased CD62L expression on CD4+ T cells compared with the GFP-ctl group, while (B) CD8+ T cells exhibited similar surface level of CD62L. Both CD8+ T and CD4+ T cells exhibited increased surface expression of (C and H) KLRG1 and (D and I) CD27, as well as (E and J) enhanced IFN-γ secretion upon rMULT1 DNA treatment. (K) Combined staining of CD4+ T cells with intracellular IFN-γ and IL-4 revealed a significantly higher Th1/Th2 ratio in CD4+ T cells of the treated mice. Open red line, rMULT1 DNA; filled green line, vehicle DNA in all representative histograms. Data are representative of 4–6 animals per subgroup and 3 independent experiments. Comparisons were between rMULT1 and GFP-ctl, *P<0.05, **P<0.01 and ***P<0.001.
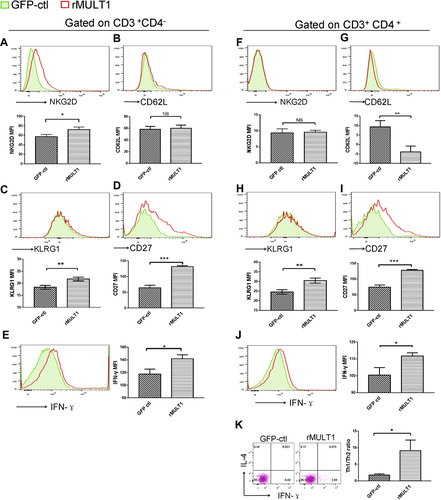
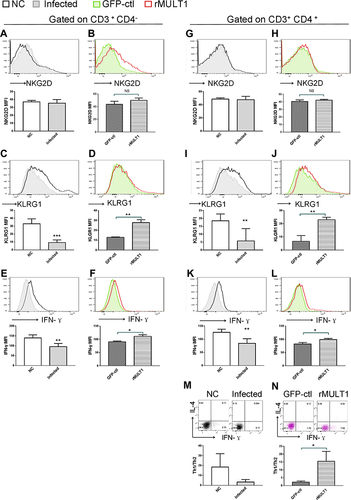
Figure 9 Impact of (A, C, E, G, I, K, M) infection and (B, D, F, H, J, L, N) rMULT1 DNA treatment on liver T-cell phenotype in mice with S. japonicum infection. Flow cytometry data revealed unchanged NKG2D levels on hepatic (A and B) CD8+ T and (G and H) CD4+ T cells in response to either (A and G) infection or (B and H) consequent treatment with rMULT1 DNA. Both CD8+ T and CD4+ T cells exhibited downregulated surface expression of (C and I) KLRG1 and (E and K) IFN-γ production upon S. japonicum infection, which were reversed by rMULT1 DNA treatment (D, J, F and L). (M and N) Combined staining of CD4+ T cells with intracellular IFN-γ and IL-4 revealed (M) a significantly descent in Th1/Th2 ratio in liver CD4+ T cells due to infection and (N) a restore of that in treated mice. Open dark line, health control; filled grey line, infected; open red line, rMULT1 DNA; filled green line, vehicle DNA in all representative histograms. Data are representative of 4–6 animals per subgroup and 3 independent experiments. Comparisons were between rMULT1 and GFP-ctl, *P<0.05, **P<0.01 and ***P<0.001.