Figures & data
Figure 1 Distance traveled and maximum speed during locomotion. (A and B) Comparison of distance traveled between hIL8+ and control mice, and hIL8+ and control mice of different sexes; (C and D) comparison of maximum speed between the 2 mouse types and mice of different sexes. Values: mean ± 95% confidence intervals; ##: p <0.01 when comparing values within the same cohort over age; **: p <0.01 when comparing values between different cohorts at a single age.
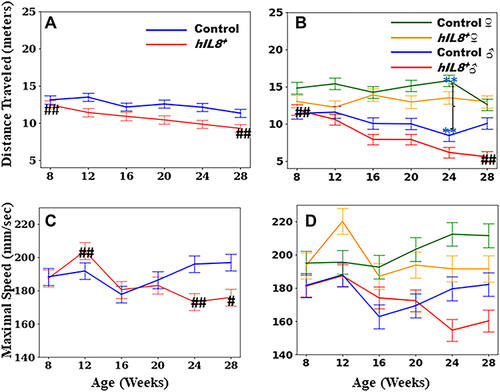
Figure 2 Time spent on locomotion and counts in locomotion. (A and B) Comparison of time spent in locomotion between hIL8+ and control mice, and hIL8+ and control mice of different sexes; (C and D) comparison of locomotion counts between the 2 mouse types, and mice of different sexes. Values: mean ± 95% confidence intervals; #: p <0.05 when comparing values within the same cohort over age; **or *: p <0.01 or p <0.05, respectively, when comparing values between different cohorts at a single age.
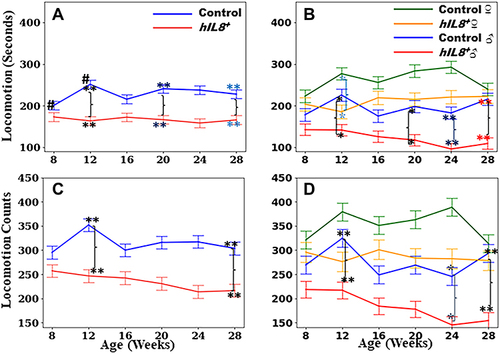
Figure 3 Time spent on climbing and climbing counts. (A and B) Comparison of time spent on climbing between hIL8+ and control mice, and hIL8+ and control mice of different sexes; (C and D) comparison of climbing counts between the 2 mouse types, and mice of different sexes. Values: mean ± 95% confidence intervals; ## p <0.01 when comparing values within the same cohort over age; **or *: p <0.01 or p <0.05, respectively, when comparing values between different cohorts at a single age.
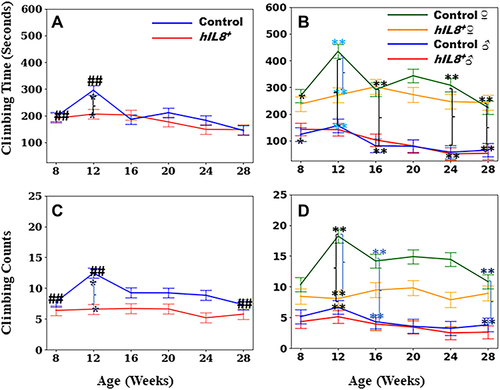
Figure 4 Time spent in rearing and rearing counts. (A and B) Comparison of time spent on rearing between hIL8+ and control mice, and hIL8+ and control mice of different sexes; (C and D) comparison of rearing counts between the 2 mouse types, and mice of different sexes. Values: mean ± 95% confidence intervals; **: p <0.01 when comparing values between different cohorts at a single age.
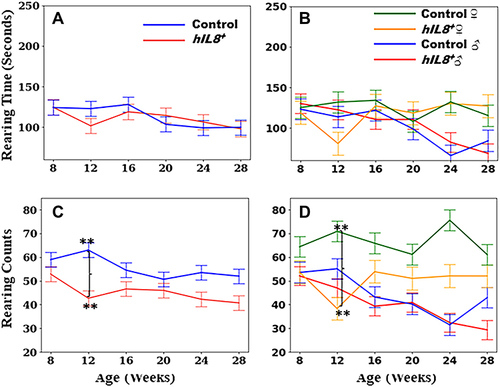
Figure 5 Time spent in eating and drinking. (A and B) Comparison of time spent on eating between hIL8+ and control mice, and hIL8+ and control mice of different sexes; (C and D) comparison of time spent on drinking between the 2 mouse types and mice of different sexes. Values: mean ± 95% confidence intervals; ## or #: p <0.01 or p <0.05, respectively, when comparing values within the same cohort over age; **or *: p <0.01 or p <0.05, respectively, when comparing values between different cohorts at a single age.
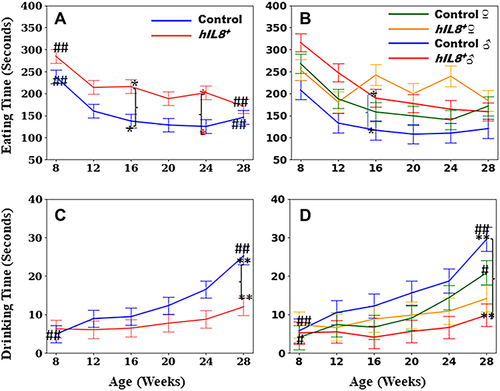
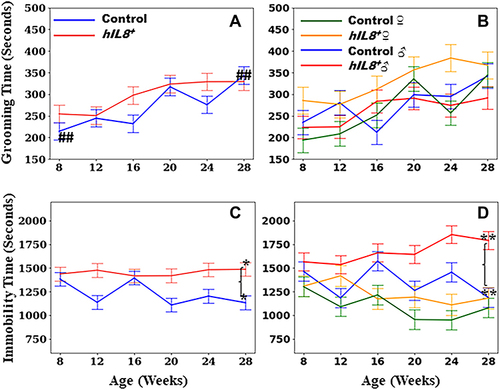
Figure 6 Time spent grooming and immobile. (A and B) Comparison of time spent on grooming between hIL8+ and control mice, and hIL8+ and control mice of different sexes; (C and D) comparison of time spent immobile between the 2 mouse types, and mice of different sexes. Values: mean ± 95% confidence intervals; ##: p <0.01 when comparing values within the same cohort over age; **or *: p <0.01 or p <0.05, respectively, when comparing values between different cohorts at a single age.