Figures & data
Figure 1 B cell subset analysis of CIA mouse spleen and peripheral blood. (A) The CIA mouse model was established using 10-week-old DBA/1 mice, which underwent two cycles of immunizations (at 0w and 3w). Healthy age-matched DBA/1 mice were used as the Ctr group. (B and C) The dynamic changes of arthritis scores in the CIA mouse model and pictures of foot arthritis in Ctr and CIA mice at 10w. (D and E) Comparison of the IgG1+GL7+ germinal center B cell in B220+ cells in the spleen of four pairs of Ctr and CIA mice (at 10w). (F and G) Comparison of the CD138+IgG1+ plasmablast percentages in B220+ cells in the peripheral blood (PB) and spleen of four pairs of Ctr and CIA mice. Data are from a single experiment representative of two independent experiments. Gating was according to isotype controls. Data are the mean ± SD. Results were compared using Student’s t test. *P < 0.05.
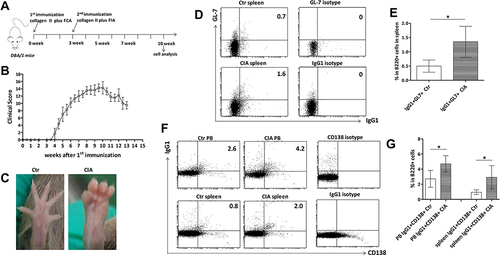
Figure 2 Analysis of changes in peripheral TFH and TFR cell levels in CIA mice. The CIA mouse model was established in 10-week-old DBA/1 mice. After two immunizations (0w, 3w), the mice were sacrificed at 5w, 7w, 10w, and 13w (n = 4 per timepoint; total = 16 CIA mice). The spleen and PB lymphocytes were separated and analyzed by flow cytometry and compared with that of age-matched Ctr mice (n = 4 per timepoint; total = 16 Ctr mice). (A) Representative flow cytometry charts showing the percentages of CD4+CXCR5+FoxP3− TFH and CD4+CXCR5+FoxP3+ TFR cells in the spleen CD4+ T cells of the two groups at 10w. (B) Analysis of the changes in the percentages (left) of TFH and TFR cells (in CD4+ lymphocytes) and their absolute numbers (right) in the spleens of the two groups (n = 4 pairs per timepoint). (C) Analysis of the percentages of TFH and TFR cells in circulating CD4+ lymphocytes of the two groups (n = 4 pairs per timepoint). (D) TFH/TFR ratios in the spleen (left) and peripheral blood (right) of CIA and Ctr mice (n = 4 pairs per timepoint). Gating was according to isotype controls. Data are from a single experiment representative of two independent experiments. Data are the mean ± SD. Results between CIA and Ctr mice for each timepoint were compared using Student’s t test. ***P < 0.001; **P < 0.01; *P < 0.05; ns, not significant; # total number of indicated cell subsets.
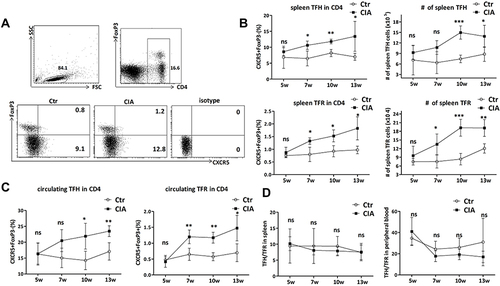
Figure 3 The effect of antibody treatment on peripheral TFH and TFR cell levels in CIA mice. (A) CIA mice were injected with anti-IL-1β or anti-TNFα+anti-IL-1β (n = 4 per treatment option) 1 week before the 10w timepoint with three consecutive injections in a week with a total amount of 0.9 mg. The Ctr mice (n = 4) were injected with isotype IgG. The mice were sacrificed at 10w and the cell subsets were analyzed. (B and C) The clinical scores of the antibody-treated CIA mice (n = 4 per group) were measured twice each week after injection and compared with the Ctr mice. C. Foot arthritic pictures of the three groups at 10w. (D) The treated mice (n = 4) were sacrificed at 10w and the percentages and absolute numbers of CD4+CXCR5+FoxP3− TFH and CD4+CXCR5+FoxP3+ TFR cells in the spleen CD4 lymphocytes were analyzed and compared with that of the Ctr mice. (E) TFH and TFR cell percentages in circulating CD4 lymphocytes were analyzed and compared among the three groups (n = 4 per group). (F) Comparison of the TFH/TFR ratios in the spleen (left) and peripheral blood (right) of the three groups (n = 4 per group). Data are from a single experiment representative of two independent experiments. Results were compared using ANOVA and multiple comparisons. Data are the mean with SD. ***P < 0.001; **P < 0.01; *P < 0.05; ns, not significant; # total number of indicated cell subsets.
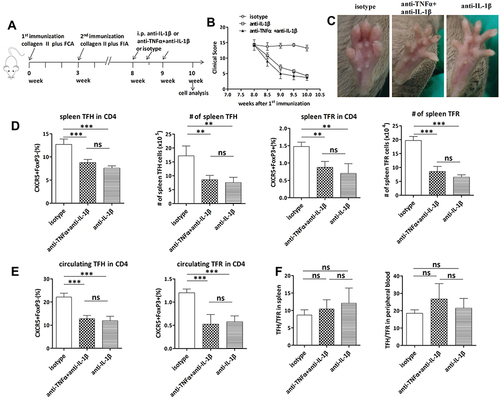
Figure 4 Analysis of PD-1 and ICOS expression on TFH and TFR cell surface in CIA mouse spleen. The CIA mouse spleen lymphocytes at 5w, 7w, 10w, and 13w (n = 4 per timepoint; total = 16 CIA mice) after the initial immunization were obtained, and PD-1 and ICOS on CD4+CXCR5+FoxP3− TFH cells and CD4+CXCR5+FoxP3+ TFR cells were detected by flow cytometry and compared with that of age-matched Ctr mice (n = 4 per timepoint; total = 16 Ctr mice). (A) Representative flow cytometry plots showing PD-1+ and/or ICOS+ percentages in TFH and TFR cells of CIA and Ctr mice at 10w. The numbers indicate the percentages of the corresponding quadrants in the TFH or TFR cells. (B) Comparison of the percentages of PD-1+, ICOS+, and PD-1+ICOS+ subsets in spleen TFH and TFR cells between the CIA and Ctr mice (n = 4 per timepoint). Data are from a single experiment representative of two independent experiments. Data are the mean ± SD. Results between the CIA and Ctr mice for each timepoint were compared using Student’s t test. ***P < 0.001; **P < 0.01; *P < 0.05; ns, not significant.
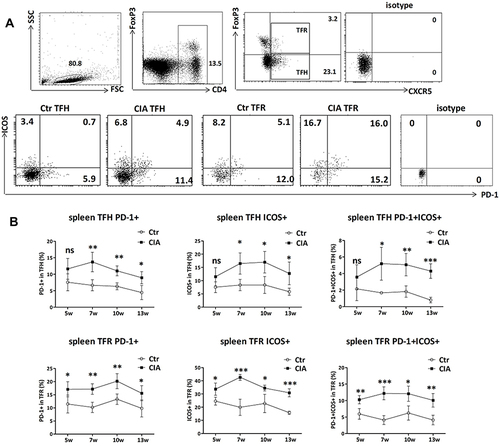
Figure 5 Analyses of IL-21 and IL-10 secretion capacity of TFH and TFR cells in CIA mouse spleen and their changes upon anti-inflammatory treatment. Spleen lymphocytes from CIA mice and Ctr DBA/1 mice were cultured and stimulated with PMA (50 ng/mL) and ionomycin (1 μg/mL) for 5 h with medium containing brefeldin A. The cells were harvested, stained for surface markers, and intracellularly stained for IL-21 and IL-10. (A) Representative flow cytometry dot plots show IL-21+ cells in CD4+CXCR5+FoxP3− TFH cells and IL-10+ cells in CD4+CXCR5+FoxP3+ TFR cells. (B) Comparison of the percentages of IL-21+ TFH cells and IL-10+ TFR cells in the spleens of CIA and Ctr mice at 5w, 7w, 10w, and 13w (n = 4 per timepoint; total = 16 CIA mice) after initial immunization. Results between the CIA and Ctr mice for each timepoint were compared using Student’s t test. (C) CIA mice were injected with anti-IL-1β or anti-TNFα+anti-IL-1β (n = 4 per treatment option) 1 week before the 10w timepoint at three consecutive injections a week with a total amount of 0.9 mg. The Ctr mice (n = 4) were injected with isotype IgG. The mice were sacrificed at 10w and changes in the IL-21+ TFH cells and IL-10+ TFR cells were compared among the groups. Gating was according to isotype controls. Results were compared using ANOVA and multiple comparisons. Data are from a single experiment representative of two independent experiments. Data are the mean with SD. ***P < 0.001; **P < 0.01; *P < 0.05; ns, not significant.
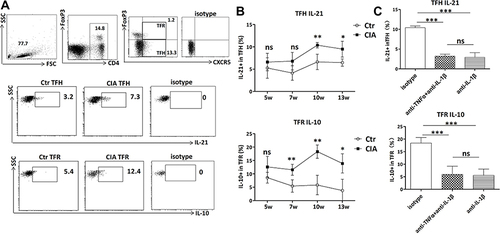
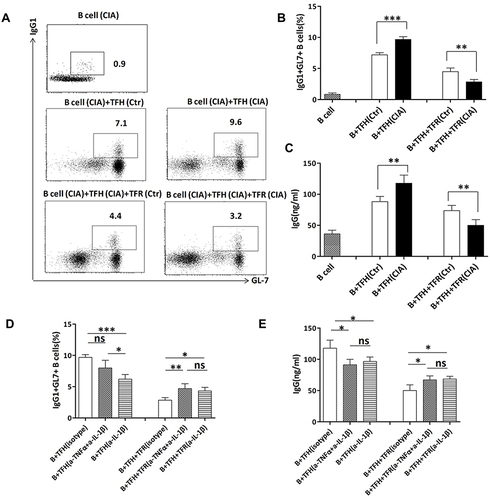
Figure 6 In vitro culture experiments for detecting the functional changes in TFH and TFR cells in CIA mouse spleen. CD4+CXCR5+CD19−GITR− TFH cells from 10w CIA mice (n = 4) and Ctr mice (n = 4) were co-cultured with CD19+ B cells (from CIA mouse spleen) for 5 days with anti-CD3 plus anti-IgM. For the TFR cell cultures, CD4+CXCR5+CD19−GITR+ TFR cells from the two groups were added to the wells along with TFH and B cells (both from CIA mouse spleen). (A) Representative flow cytometry dot plots of harvested cells showing GL7+ germinal center B cells that secrete IgG1. The numbers indicate the proportions of GL7+IgG1+ in the CD19+ cells. (B) Comparison of the percentages of GL7+IgG1+ cells in the culture systems. Each group contained cells from the spleens of four mice and each sample was tested once. Results are the mean ± SD. Results between CIA and Ctr mice were compared using Student’s t test. (C) Comparison of IgG concentrations in the supernatant of different cultures. Each group contained cells from four mouse spleens and each sample was tested twice. The data are the mean with SEM. Results between CIA and Ctr mice were compared using Student’s t test. (D and E) TFH and TFR cells derived from CIA mice (10w) were injected with anti-inflammatory antibodies (anti-IL-1β or anti-TNFα+anti-IL-1β) or isotype IgG (n = 4 mice per group) and their functions were measured by co-culture. GL7+IgG1+ cells and IgG levels in the supernatant were measured and compared. The data are the mean with SD. The three groups were compared using ANOVA and multiple comparisons. Data are from a single experiment representative of two independent experiments. ***P < 0.001; **P < 0.01; *P < 0.05; ns, not significant.