Figures & data
Table 1 Demographic Characteristics of COPD Patients in the Derivation and Validation Cohorts
Figure 1 Identification of DEGs and hub genes in COPD. (A) Volcano plot of DEGs. Red dots represent relatively upregulated genes and blue dots represented downregulated genes. No significantly changed genes were marked as gray dots. (B) The PPI network of the DEGs visualized Cytoscape software. The bluer the color, the larger the topological coefficient. (C) Hub genes with the top 10 MCC were identified using the CytoHubba plugin. The redder the color, the larger the MCC. (D) Heatmap of the 10 hub genes.
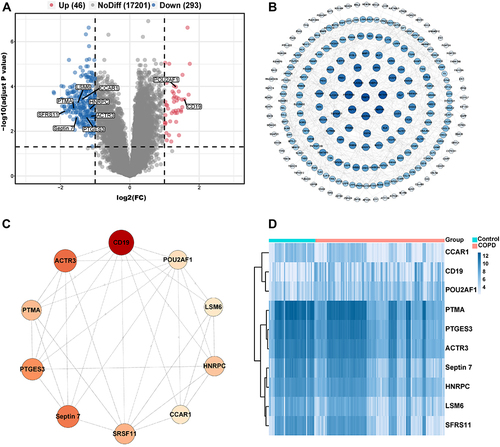
Figure 2 ROC curve of hub genes. The ROC curve of CD19 (A), POU2AF1 (B), PTMA (C), LSM6 (D), CCAR1 (E), SFRS11 (F), ACTR3 (G), Septin7 (F), PTGES3 (I), and HNRPC (J) were represented.
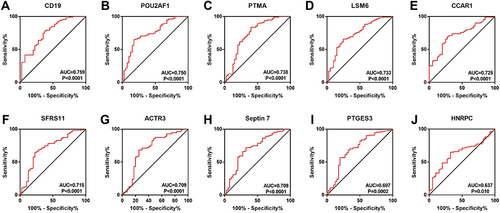
Figure 3 Analysis of the correlation between genes with lung function and CT indexes of emphysema. Blue represents a negative correlation; red represents a positive correlation. **P<0.01, *P<0.05.
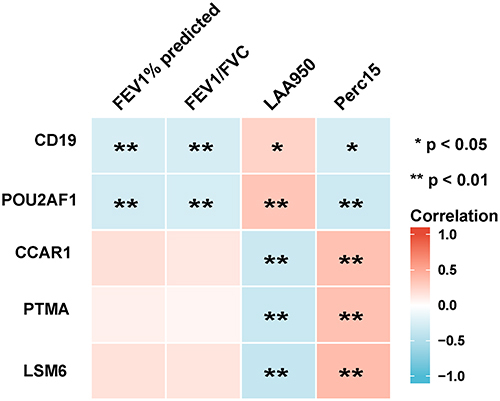
Figure 4 The enriched biological process of DEGs in high- and low- CD19 or POU2AF1 expression groups and immune correlation analysis in GSE76925. (A) GO-BP and KEGG pathway enrichment analysis of DEGs in high- and low- CD19 expression groups. (B) GO-BP and KEGG pathway enrichment analysis of DEGs in high- and low- POU2AF1 expression groups. The x-axis depicts the –log10 (P-value). The y-axis lists the enriched functional terms. (C) Correlation between CD19 and immune cells in COPD. (D) Correlation between POU2AF1 and immune cells in COPD. The size of the dots represented the strength of the correlation between genes and immune cells; the larger the dots, the stronger the correlation, and the smaller the dots, the weaker the correlation. The color of the dots represented the P-value, the blacker the color, the lower the P-value, and the bluer the color, the larger the P-value.
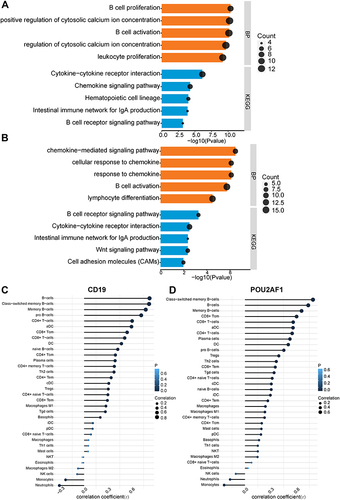
Figure 5 Performance of CD19 and POU2AF1 in validation sets (GSE47460). (A) ROC curve of CD19 for COPD. (B) ROC curve of POU2AF1 for COPD. (C) The correlation analysis between CD19 and POU2AF1 with lung function and CT indexes of emphysema. Blue represented a negative correlation; red represented a positive correlation. (D) The expression of CD19 in different disease severity of COPD. (E) The expression of POU2AF1 in different disease severity of COPD. (F) GO-BP and KEGG pathway enrichment analysis of DEGs in high- and low- CD19 expression groups. (G) GO-BP and KEGG pathway enrichment analysis of DEGs in high- and low- POU2AF1 expression groups. The x-axis depicts the –log10 (P-value). The y-axis lists the enriched functional terms. (H) Correlation between CD19 and immune cells in COPD. (I) Correlation between POU2AF1 and immune cells in COPD. The size of the dots represented the strength of the correlation between genes and immune cells; the larger the dots, the stronger the correlation, and the smaller the dots, the weaker the correlation. The color of the dots represented the P-value, the blacker the color, the lower the P-value, and the bluer the color, the larger the P-value. ***P<0.001, **P<0.01.
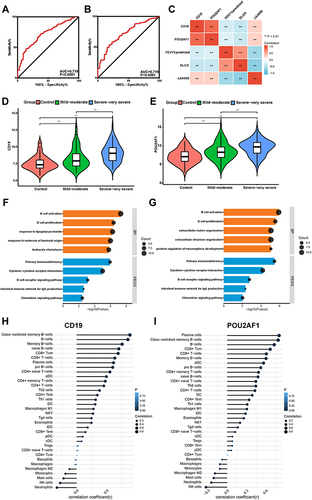
Figure 6 Performance of CD19 and POU2AF1 in validation sets (GSE76705). (A) ROC curve of CD19 for COPD. (B) ROC curve of POU2AF1 for COPD. (C) The correlation analysis between CD19 and POU2AF1 with lung function. Blue represented a negative correlation; red represented a positive correlation. **P<0.01, *P<0.05. (D) The expression of CD19 in COPD and control group. (E) The expression of POU2AF1 in COPD and control group. (F) Correlation between CD19 and immune cells in COPD. (G) Correlation between POU2AF1 and immune cells in COPD. The size of the dots represented the strength of the correlation between genes and immune cells; the larger the dots, the stronger the correlation, and the smaller the dots, the weaker the correlation. The color of the dots represented the P-value, the blacker the color, the lower the P-value, and the bluer the color, the larger the P-value.
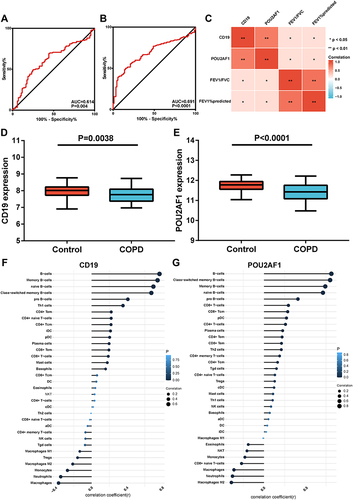
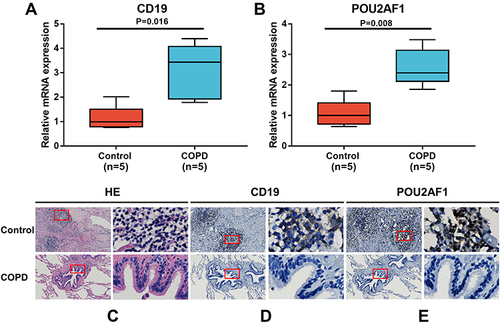
Figure 7 Expression of CD19 and POU2AF1 by qRT-PCR and immunohistochemistry. (A) The mRNA levels of CD19 in human lung tissues. (B) The mRNA levels of CD19 in human lung tissues. The mRNA levels of CD19 and POU2AF1 were normalized to β-actin. **P<0.01 compared with the control group. (C) HE staining in control and patients with COPD. (D) Immunohistochemical staining for CD19 in control and patients with COPD. (E) Immunohistochemical staining for POU2AF1 in control and patients with COPD. Positive protein staining appeared brown and nuclear staining appeared blue. Scale bar =100 μm, original magnification: ×50; scale bar=10 μm, original magnification: ×400.