Figures & data

Figure 1 Representative flow cytometry plots. The presented plots denote gating for lymphocytes (A), gating for CD4+ lymphocytes (B), Th1 lymphocytes (C), Th2 lymphocytes (D), Th17 lymphocytes (E), Th17.1 lymphocytes (F), PD1+ CD4+ T lymphocytes (G), PD1+ Th17 lymphocytes (H) and T regulatory lymphocytes (I). The red markings indicate gating for lymphocytes on forward scatter vs side scatter plot. The blue boxes indicate gating for CD4+ lymphocytes within the lymphocyte gate.
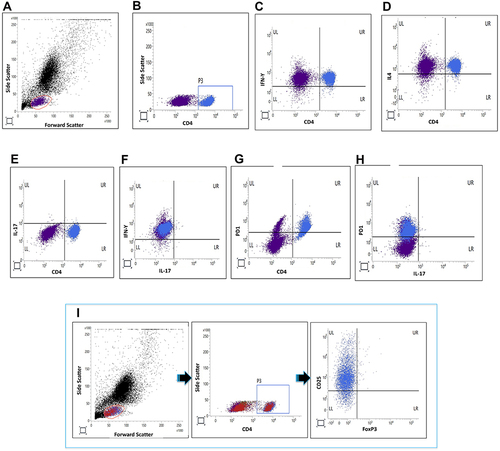
Table 1 Characteristics of Patients with Takayasu Arteritis
Figure 2 Comparison of T helper lymphocyte populations between patients with Takayasu arteritis (TAK), healthy controls (HC) and disease control group of sarcoidosis (SAR). (A) Th1 lymphocytes (B) Th2 lymphocytes (C) Th17 lymphocytes (D) T regulatory lymphocytes (Treg) (E) Th17.1 lymphocytes (F) PD1+CD4+ T lymphocytes (G) PD1+Th17 lymphocytes (H) Th1 lymphocytes normalised to Tregs (I) Th2 lymphocytes normalised to Tregs (J) Th17 lymphocytes normalised to Tregs (K) Th17.1 lymphocytes normalised to Tregs (L) PD1+CD4+ T lymphocytes normalised to Tregs (M) PD1+Th17 lymphocytes normalised to Tregs. Data on T helper lymphocyte populations are presented for 57 patients with TAK [except for Th17.1 lymphocytes (n= 56) and PD1+CD4+ and PD1+Th17 T lymphocytes (n=52)], 21 healthy controls and 11 patients with sarcoidosis. Comparisons are presented between TAK and HC, and between TAK and SAR (p values presented for Mann–Whitney test after Bonferroni-Sidak correction). p values <0.05 are highlighted in bold.
![Figure 2 Comparison of T helper lymphocyte populations between patients with Takayasu arteritis (TAK), healthy controls (HC) and disease control group of sarcoidosis (SAR). (A) Th1 lymphocytes (B) Th2 lymphocytes (C) Th17 lymphocytes (D) T regulatory lymphocytes (Treg) (E) Th17.1 lymphocytes (F) PD1+CD4+ T lymphocytes (G) PD1+Th17 lymphocytes (H) Th1 lymphocytes normalised to Tregs (I) Th2 lymphocytes normalised to Tregs (J) Th17 lymphocytes normalised to Tregs (K) Th17.1 lymphocytes normalised to Tregs (L) PD1+CD4+ T lymphocytes normalised to Tregs (M) PD1+Th17 lymphocytes normalised to Tregs. Data on T helper lymphocyte populations are presented for 57 patients with TAK [except for Th17.1 lymphocytes (n= 56) and PD1+CD4+ and PD1+Th17 T lymphocytes (n=52)], 21 healthy controls and 11 patients with sarcoidosis. Comparisons are presented between TAK and HC, and between TAK and SAR (p values presented for Mann–Whitney test after Bonferroni-Sidak correction). p values <0.05 are highlighted in bold.](/cms/asset/dee88336-41f2-4064-8d2d-b9aae97fcbd9/djir_a_12199820_f0002_c.jpg)
Figure 3 Comparison of cytokines in serum and in culture supernatant of peripheral blood mononuclear cells following stimulation with anti-CD3/ anti-CD28 between patients with Takayasu arteritis (TAK), healthy controls (HC) and disease control group of sarcoidosis (SAR). (A) IFN-γ in serum (B) IFN-γ in culture supernatant (C) IL-4 in serum (D) IL-4 in culture supernatant (E) IL-17A in serum (F) IL-17A in culture supernatant (G) IL-6 in serum (H) IL-6 in culture supernatant (I) IL-23 in serum (J) IL-23 in culture supernatant (K) TGF-β1 in serum (L) TGF-β1 in culture supernatant (M) IL-10 in serum (N) IL-10 in culture supernatant) (O) TNF-α in serum (P) TNF-α in culture supernatant (Q) IL-1β in serum (R) IL-1β in culture supernatant The cytokines IFN-γ, IL-4, IL-17A, IL-23, IL-1β and IL-10 were undetectable in serum in most patients and controls. In such instances, the lower limit of the detectable range for the ELISA kit was used for graphical representation of data. Data on serum cytokines presented for 56 patients with TAK, 21 healthy controls and 11 patients with sarcoidosis. Data on cytokines in culture supernatant are presented for 52 patients with TAK, 21 healthy controls and 11 patients with sarcoidosis. Comparisons are presented between TAK and HC, and between TAK and SAR (p values presented for Mann–Whitney test after Bonferroni-Sidak correction). p values <0.05 are highlighted in bold.
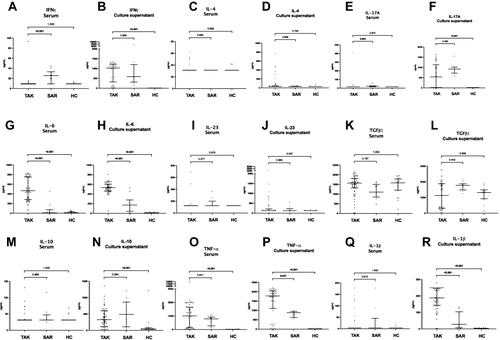
Table 2 Comparison of T Helper Lymphocyte Profiles and Cytokines Between Patients with Takayasu Arteritis with Active and Inactive Disease
Table 3 Logistic Regression Analysis for Associations of Disease Activity in Takayasu Arteritis
Table 4 Comparison of T Helper Lymphocyte Profiles and Cytokines Between Patients with Takayasu Arteritis Who Were Immunosuppressive Treatment-Naïve and Those on Immunosuppressive Therapy
Figure 4 Cytokine production following in-vitro stimulation of peripheral blood mononuclear cells from patients with Takayasu arteritis with anti-CD3/anti-CD28 alone, with tacrolimus, with tadalafil or with a combination of tacrolimus and tadalafil. Cytokines presented in each graph (A) IFN-γ (B) IL-4 (C) IL-17A (D) IL-23 (E) TGF-β1 (F) IL-10 (G) IL-6 (H) IL-1β (I) TNF-α Wherever cytokines were undetectable, the lower limit of the detectable range for the ELISA kit was used for graphical representation of data. Data on cytokines in culture supernatant are presented for 52 patients with TAK. Comparisons are presented between unstimulated and post-stimulation with anti-CD3/anti-CD28, post-stimulation with anti-CD3/anti-CD28 alone or along with tacrolimus, post-stimulation with anti-CD3/anti-CD28 alone or along with tadalafil, and post-stimulation with anti-CD3/anti-CD28 with tacrolimus or with tacrolimus and tadalafil (p values presented for Wilcoxon matched-pairs signed rank test after Bonferroni-Sidak correction). p values <0.05 are highlighted in bold.
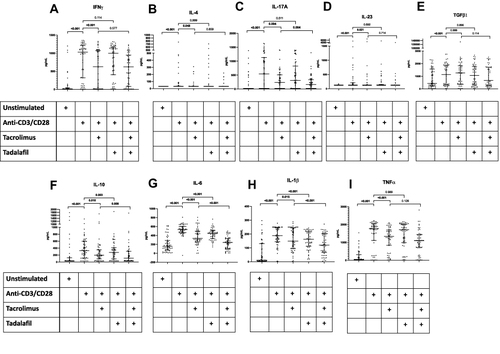
Figure 5 T helper lymphocyte profiles in patients with TAK before and after immunosuppressive therapy. (A) Th1 lymphocytes (B) Th2 lymphocytes (C) Th17 lymphocytes (D) T regulatory lymphocytes (Treg) (E) Th17.1 lymphocytes (F) PD1+CD4+ T lymphocytes (G) PD1+Th17 lymphocytes (H) Th1 lymphocytes normalised to Tregs (I) Th2 lymphocytes normalised to Tregs (J) Th17 lymphocytes normalised to Tregs (K) Th17.1 lymphocytes normalised to Tregs (L) PD1+CD4+ T lymphocytes normalised to Tregs (M) PD1+Th17 lymphocytes normalised to Tregs. Data on Th1, Th2, Th17 and Treg are presented for 16 pairs, Th17.1 for 15 pairs, PD1+CD4+ T lymphocytes and PD1+Th17 lymphocytes for 12 pairs. Comparisons are present before and after treatment (p values presented for Wilcoxon matched pairs signed rank test after Bonferroni-Sidak correction). p values <0.05 are highlighted in bold. Median duration of follow-up 0.21 (0.13–2.52) years. All patients had been treated with corticosteroids (ongoing in 15/16 at follow-up sample collection). 9 were on tacrolimus alone, 2 were on tacrolimus and methotrexate, one was on methotrexate alone. At the time of follow-up sample collection, disease activity had ceased clinically in 14/16 patients.
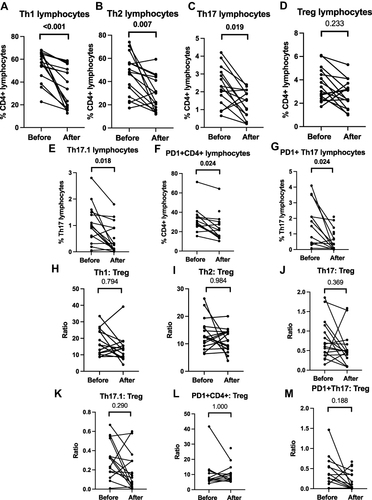
Figure 6 Cytokine profiles in patients with TAK before and after immunosuppressive therapy. (A) IFN-γ in serum (B) IFN-γ in culture supernatant (C) IL-4 in serum (D) IL-4 in culture supernatant (E) IL-17A in serum (F) IL-17A in culture supernatant (G) IL-6 in serum (H) IL-6 in culture supernatant (I) IL-23 in serum (J) IL-23 in culture supernatant (K) TGF-β1 in serum (L) TGF-β1 in culture supernatant (M) IL-10 in serum (N) IL-10 in culture supernatant) (O) TNF-α in serum (P) TNF-α in culture supernatant (Q) IL-1β in serum (R) IL-1β in culture supernatant. Wherever cytokines were undetectable, the lower limit of the detectable range for the ELISA kit was used for graphical representation of data. Data are presented for 16 pairs for serum cytokines and 12 pairs for culture supernatant for IFN-γ, IL-4, IL-17A, IL-6, IL-23, TGF-β1, IL-10, TNF-α; for 13 pairs for serum cytokines and 13 pairs for culture supernatant for IL-1β. Comparisons are present before and after treatment (p values presented for Wilcoxon matched pairs signed rank test after Bonferroni-Sidak correction). p values <0.05 are highlighted in bold. Median duration of follow-up 0.21 (0.13–2.52) years. All patients had been treated with corticosteroids (ongoing in 15/16 at follow-up sample collection). 9 were on tacrolimus alone, 2 were on tacrolimus and methotrexate, one was on methotrexate alone. At the time of follow-up sample collection, disease activity had ceased clinically in 14/16 patients.
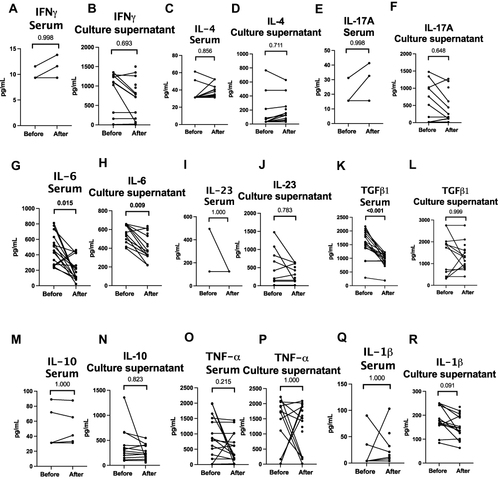
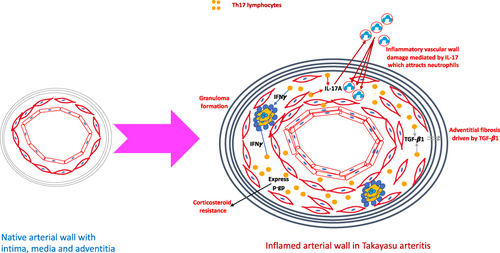
Figure 7 Putative mechanisms by which Th17 lymphocytes play a role in the pathogenesis of Takayasu arteritis. When compared with the native arterial wall, the arterial wall in large vessel vasculitis is thickened, with intimal proliferation, thickening of the media due to inflammatory cell infiltrate and adventitial fibrosis. T helper 17 (Th17) lymphocytes secrete the cytokine interleukin 17A (IL-17A) which attracts neutrophils to the media where they degranulate and release enzymes resulting in tissue destruction. Th17.1 lymphocytes secrete interferon gamma (IFN-γ) which contributes towards granuloma formation. Th17.1 lymphocytes also express p-glycoprotein and are resistant to corticosteroids. Programmed cell death 1 (PD1) positive Th17 lymphocytes secrete transforming growth factor beta 1 (TGF-β1) which in turn drives adventitial fibrosis.