Figures & data
Table 1 Comparison of Mean Values of Demographic Data, Uric Acid, CRP, IL-6, and TNF-α Levels in Serum Between the Gout and Control Groups (Mean ± SEM)
Figure 1 Correlation between serum uric acid and pro-inflammatory cytokines levels (Pearson correlation analysis).
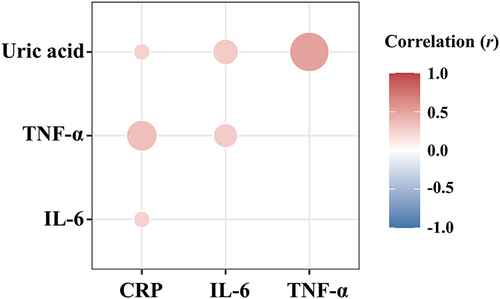
Table 2 ROC Analysis of Various Indicators for Diagnosis of Gout
Figure 2 ROC curve of serum uric acid and pro-inflammatory cytokines in identification of the patients with gout. (A) ROC curve of uric acid; (B) ROC curve of CRP; (C) ROC curve of IL-6; (D) ROC curve of TNF-α.
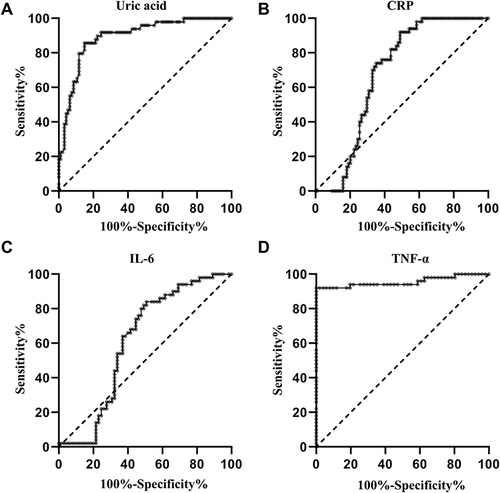
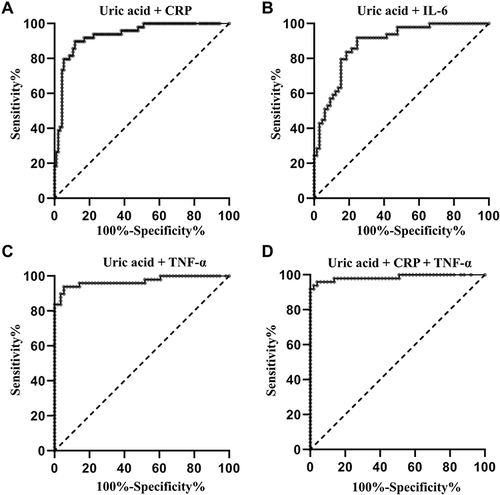
Figure 3 ROC curve for the combination of uric acid and pro-inflammatory cytokines in identification of the patients with gout. (A) ROC curve for the combination of uric acid and CRP; (B) ROC curve for the combination of uric acid and IL-6; (C) ROC curve for the combination of uric acid and TNF-α; (D) ROC curve for the combination of uric acid, CRP, and TNF-α.