Figures & data
Figure 1 MitoQ alleviated cerulein-induced pancreatic fibrosis in CP in vivo. (A) Flow chart of animal experiment (bw: body weight; i.p: intraperitoneal injection). (B) Body weight change during CP model and MitoQ treatment. (C) The weight of the pancreas and pancreas/body weight ratio (P/W) after mice sacrifice. (D) H&E Masson-trichrome, and Sirius Red staining of the pancreatic tissue and quantitative assessment of the pancreatic fibrosis. (E) mRNA level of fibrosis-related genes, Col1a, Col III, and TIMP1. (F) Protein level of α-SMA in pancreatic tissue. (G) Immunohistochemical staining of α-SMA in pancreatic tissue. Data are expressed as mean ± SEM, n=4-8. (*p<0.05, **p<0.01, ***p<0.001).
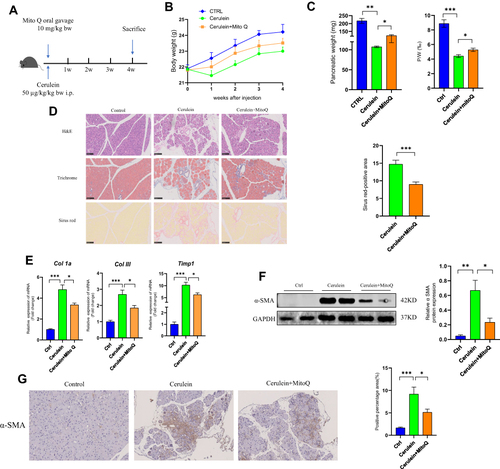
Figure 2 MitoQ inhibits OS of pancreatic tissue in CP mouse model. (A) MDA level in serum. (B) mRNA level of SOD1 and SOD2 in the pancreatic tissue. (C) SOD enzyme activity in the pancreatic tissue. (D) mRNA level of GPXs and CAT in pancreatic tissue. (E) The content of GSH in pancreatic tissue. (F) The mRNA level of NOXs. (G) Protein level of GPX8 and CAT in pancreatic tissue. Data are expressed as mean ± SEM, n=3-8. (*p<0.05, **p<0.01, ***p<0.001).
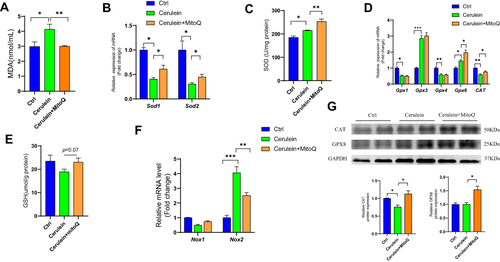
Figure 3 MitoQ inhibits the activation of hPSCs and development of profibrogenic phenotype in vitro. (A) mRNA levels of α-SMA, COL1a, and COLIII in hPSCs after MitoQ treatment for 48 hours. (B) The protein levels of α-SMA and COL1a in hPSCs after MitoQ treatment for 48 hours. (C) Immunofluorescence (IF) staining of α-SMA of hPSCs following MitoQ treatment for 48h. (D) The effect of MitoQ on the proliferation of hPSCs using cell-counting assays and EdU incorporation assay. (E) The effect of MitoQ on the apoptosis of hPSCs by flow cytometry. Data are expressed as mean ± SEM, n=3-8. (*p<0.05, **p<0.01, ***p<0.001).
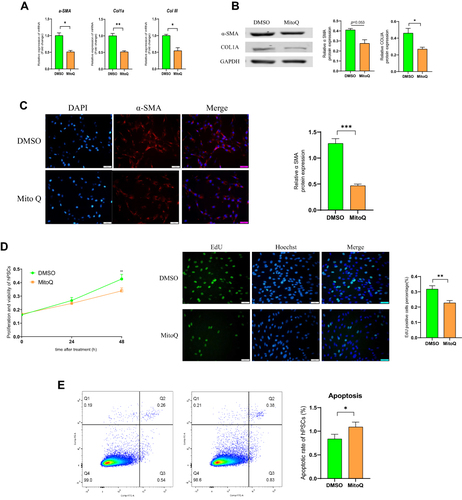
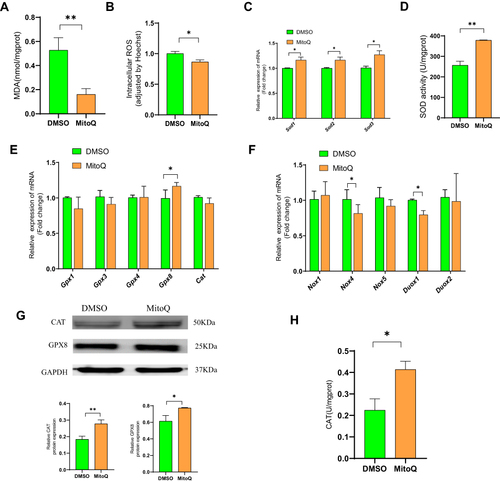
Figure 4 MitoQ suppresses OS in hPSCs. (A) Intracellular MDA level of hPSCs after MitoQ treatment for 48h. (B) Intracellular ROS level of hPSCs after MitoQ treatment for 48h. (C) The mRNA level of Sod1, Sod2, and Sod3 of hPSCs after MitoQ treatment for 48h. (D) SOD activity of hPSCs after MitoQ treatment for 48h. (E) mRNA level of GPXs and CAT in hPSCs after MitoQ treatment for 48h. (F) mRNA level of NOX and DUOX enzymes in hPSCs after MitoQ treatment for 48h. (G) Protein level of GPX8 and CAT in hPSCs after MitoQ treatment for 48h. (H) CAT activity in hPSCs after MitoQ treatment for 48h. Data are expressed as mean ± SEM, n=3-8. (*p<0.05, **p<0.01).