Figures & data
Figure 1 Higher chemokine expression correlates with glioma malignancy. (A and B) 41 chemokines expression profiles at mRNA level in the normal and GBM tissues from the GTEx and TCGA databases. (C and D) 41 chemokines expression profiles at the mRNA level by clinical characteristics in the TCGA database were shown based on the grade in gliomas. Grade II: G2; Grade III: G3; Grade IV: G4. (E and F) 41 chemokines expression levels were shown based on IDH mutant status in GBM. The pink rectangles marked the chemokines that had increased mRNA expression levels, while the blue rectangles marked the chemokines that had decreased mRNA expression levels. *p < 0.05, **p < 0.01, ***p < 0.001.
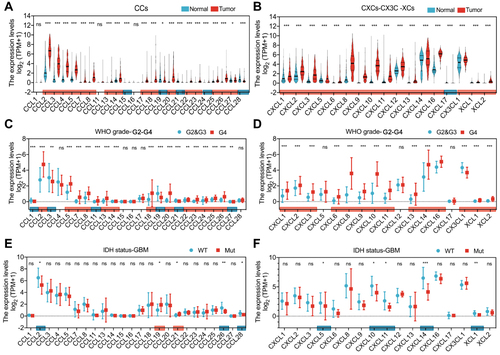
Figure 2 Prognostic values of different chemokines in GBM. (A) Forest plot of associations of 35 chemokines expression and OS showed that seven chemokines (CCL2, CCL8, CCL18, CCL28, CXCL1, CXCL5, and CXCL13, marked in pink) were independently associated with the OS of GBM patients. (B) The Kaplan-Meier analysis of the association between seven chemokines and DSS. (C) The Kaplan-Meier analysis of the association between seven chemokines and PFI.
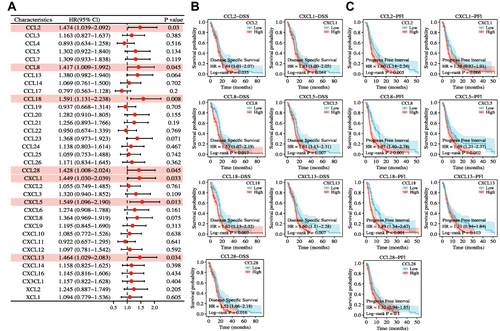
Figure 3 Correlations between seven prognosis-related chemokines expression and immune cell pathway or immune checkpoint molecules in GBM from the TCGA dataset. (A) Correlations between the infiltration of immune cells and the expression of the indicated chemokines. (B) Correlations between different chemokines in GBM. (C) Correlation analysis of the indicated chemokines expression levels with 40 common immune checkpoint genes in GBM.
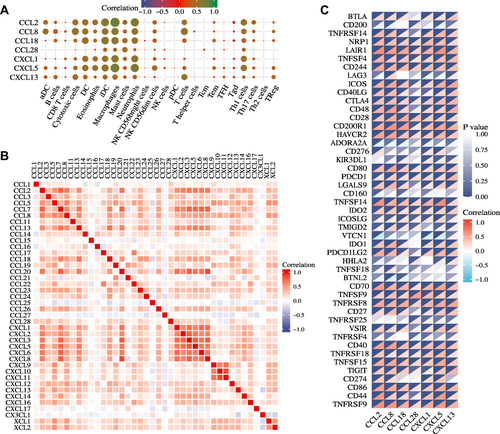
Figure 4 Volcano plots and heatmap plots of DEmRNAs between the expression of chemokinehigh and chemokinelow in GBM samples. (A–D) Differentially expressed genes for high expression of the prognosis-related chemokines vs low expression of the prognosis-related chemokines in GBM were shown in the volcano plots. Red represented upregulated genes, and blue indicated downregulated genes. Heatmaps of differentially expressed genes were shown in the lower panel. 15 significant DEGs were shown for each chemokine. (E) Common differentially expressed genes representation through Venn diagrams. 89 genes were found commonly from CCL2, CCL8, CCL18, and CCL28 datasets. (F) 229 genes were found commonly from CXCL1, CXCL5, and CXCL13 datasets. *p < 0.05, **p < 0.01, ***p < 0.001.
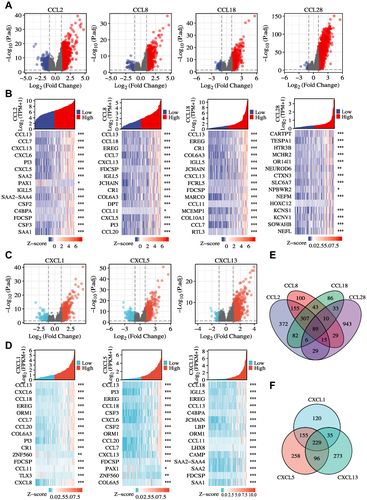
Figure 5 Identification of DEGs, functions, pathways, and protein-protein network (PPI) of the prognosis-related chemokines in GBM. (A) The Venn diagrams showed a total of 64 overlapped DEGs identified from the CCLs (CCL2, 8, 18, 28) and CXCLs (CXCL1, 5, 13) datasets. (B) GO and KEGG analysis showed multiple biological processes and several pathways of the overlapped DEGs. (C) Functional enrichment analysis showed five pathways of the prognosis-related overlapped DEGs. (D) Protein-protein interactions (PPIs) network identified common differentially expressed genes shared by the seven prognosis-related chemokines datasets. Nodes in red indicated the seven prognosis-related chemokines, and nodes in pink showed the prognosis-related common genes in GBM.
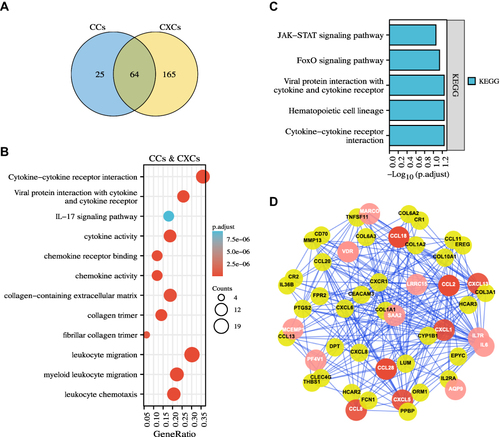
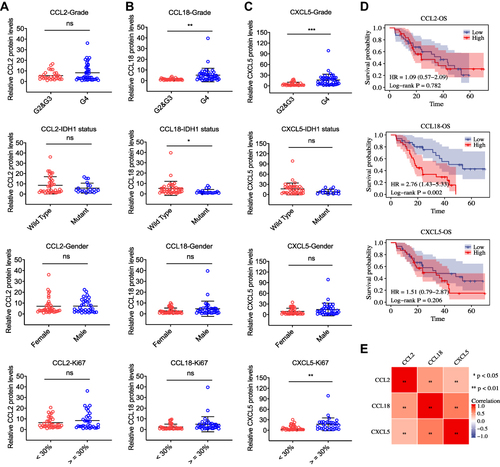
Figure 6 The protein expression levels of CCL2, CCL18, and CXCL5 in 72 human glioma tissues. (A–C) Quantification of indicated protein expression levels in patients grouped by G2 & G3 gliomas and GBM (G4), IDH1 wild type and mutant, female and male, low Ki67 rate (< 30%) and high Ki67 rate (≥ 30%), respectively. The relative CCL2, CCL18, and CXCL5 protein levels of human glioma tissue lysates were firstly measured by ELISA and then normalized to that of β-actin. (D) Kaplan-Meier OS curves (High vs Low) for patients stratified by different protein levels of CCL2, CCL18, and CXCL5 in gliomas. (E) Correlation between CCL2, CCL8, and CXCL5 expression in our cohort. All data are representative of three independent experiments. *p < 0.05, **p < 0.01, ****p < 0.0001, ns, no significance.