Figures & data
Table 1 Adult Human Normal Tissue Lysates and Monkey Normal Tissue Cell Lysates
Table 2 Adult Human and Monkey Normal PBMCs Lysates
Figure 1 TILRR protein expression in normal human tissues. Tissue lysates (2.5 µg/lane protein) were examined by Western blot (green color, left) and Coomassie blue staining (red color, right). TILRR protein was probed by primary mouse anti-TILRR F218G4 mAb followed by secondary goat anti-mouse IRDye 800CW antibody (1:10,000; LI-COR). TILRR protein bands (70 kDa, green color, cropped) are shown on the top of the bar graph (see Figure S1A for un-cropped blot image). Untransferred proteins in the gel after iBlot transfer were stained with Coomassie blue staining (G-250, Bio-Rad) and the protein bands (~70 kDa, red color, cropped) are shown on the top of the bar graph (see Figure S1B for un-cropped blot image). The bar graph shows the TILRR protein intensity (R.F.U) for each tissue lysate (n=1) where X-axis demonstrates the normal human tissue lysates and Y-axis indicates the signal intensity (R.F.U). kDa, kiloDalton; RFU, relative fluorescence units; S. intestine, small intestine (ileum).
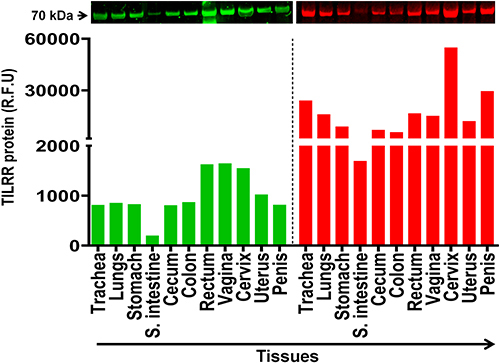
Figure 2 TILRR protein expression in normal Cynomolgus monkey tissues. (A) Tissue lysates (5.0 µg/lane proteins) were examined by Western blot (green color, left) and Coomassie blue staining (red color, right). TILRR protein was probed by primary mouse anti-TILRR F218G4 mAb followed by secondary goat anti-mouse IRDye 800CW antibody (1:10,000; LI-COR). TILRR protein bands (70 kDa, green color, cropped) are shown on the top of the bar graph (Figure S1C shows the un-cropped blot image). Untransferred proteins in the gel after iBlot transfer were stained with Coomassie blue staining (G-250, Bio-Rad) and the protein bands (~70 kDa, red color, cropped) are shown on the top of the bar graph (Figure S1D shows the un-cropped gel). The bar graph indicates the TILRR protein intensity (R.F.U) for each tissue lysate (n=1). (B) TILRR protein intensity (R.F.U) (median with interquartile range [IQR]) of each tissue cell lysate observed in two cynomolgus monkeys (n=2). The X-axis represents the normal Cynomolgus monkey tissue cell lysates and Y-axis shows the signal intensity (R.F.U). AM271 and BM843 are the monkeys’ identification numbers. kDa, kiloDalton; RFU, relative fluorescence units; n= number of subjects.
![Figure 2 TILRR protein expression in normal Cynomolgus monkey tissues. (A) Tissue lysates (5.0 µg/lane proteins) were examined by Western blot (green color, left) and Coomassie blue staining (red color, right). TILRR protein was probed by primary mouse anti-TILRR F218G4 mAb followed by secondary goat anti-mouse IRDye 800CW antibody (1:10,000; LI-COR). TILRR protein bands (70 kDa, green color, cropped) are shown on the top of the bar graph (Figure S1C shows the un-cropped blot image). Untransferred proteins in the gel after iBlot transfer were stained with Coomassie blue staining (G-250, Bio-Rad) and the protein bands (~70 kDa, red color, cropped) are shown on the top of the bar graph (Figure S1D shows the un-cropped gel). The bar graph indicates the TILRR protein intensity (R.F.U) for each tissue lysate (n=1). (B) TILRR protein intensity (R.F.U) (median with interquartile range [IQR]) of each tissue cell lysate observed in two cynomolgus monkeys (n=2). The X-axis represents the normal Cynomolgus monkey tissue cell lysates and Y-axis shows the signal intensity (R.F.U). AM271 and BM843 are the monkeys’ identification numbers. kDa, kiloDalton; RFU, relative fluorescence units; n= number of subjects.](/cms/asset/6d1f9261-f5b7-46a4-a64d-8917bdc1eb8e/djir_a_12199604_f0002_c.jpg)
Figure 3 TILRR protein expression in normal human and macaque PBMCs. (A) PBMC lysates (14.0 µg/lane proteins) of humans (n=4), rhesus monkeys (n=4), and cynomolgus monkeys (n=4) were analyzed by Western blot (green color, left) and Coomassie blue staining (red color, right). TILRR protein was probed by primary mouse anti-TILRR F218G4 mAb followed by secondary goat anti-mouse IRDye 800CW antibody (1:10,000; LI-COR). TILRR protein bands (70 kDa, green color, cropped) are shown on the top of the bar graph (see Figure S2A for un-cropped blot image). Untransferred proteins in the gel after iBlot transfer were stained with Coomassie blue staining (G-250, Bio-Rad), and the protein bands (~70 kDa, red color, cropped) are shown on the top of the bar graph (see Figure S2B for un-cropped gel). The bar graph shows the TILRR protein intensity (R.F.U). (B) TILRR protein intensity (R.F.U) (median with IQR) of PBMC lysates observed in four study subjects (n=4) including humans, rhesus monkeys, and cynomolgus monkeys. (C) TILRR protein expression between humans and monkeys. Data are shown as median with IQR in figures B and C. A t-test with 95% CI was used for statistical comparisons and all p<0.05 were reported as statistically significant and presented with asterisks. The X-axis of figure A indicates the patients’ and monkeys’ identification numbers and Y-axis shows the signal intensity (R.F.U). kDa, kiloDalton; RFU, relative fluorescence units; n= number of subjects; ID#, identification number, Rhesus M, rhesus monkey; Cyno M, cynomolgus monkey.
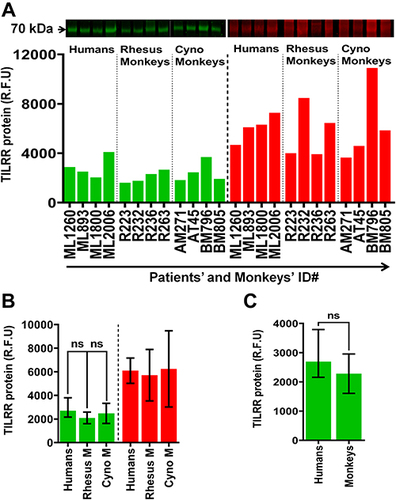
Figure 4 TILRR protein expression in human cell lines. Cell line lysates (7 µg/lane protein) were examined by Western blot (green color, left) and Coomassie blue (red color, right). TILRR protein was probed by primary mouse anti-TILRR F218G4 mAb followed by secondary goat anti-mouse IRDye 800CW antibody (1:10,000; LI-COR). TILRR protein bands (70 kDa, green color, cropped) are shown on the top of the bar graph (Figure S3A shows the un-cropped blot image). Untransferred proteins in the gel after iBlot transfer were stained with Coomassie blue staining (G-250, Bio-Rad) and the protein bands (~70 kDa, red color, cropped) are shown on the top of the bar graph (Figure S3B shows the un-cropped gel). The bar graph shows the TILRR protein intensity (R.F.U) for each tissue lysate (n=1) where X-axis demonstrates human cell lines and Y-axis represents signal intensity (R.F.U). kDa, kiloDalton; RFU, relative fluorescence units.
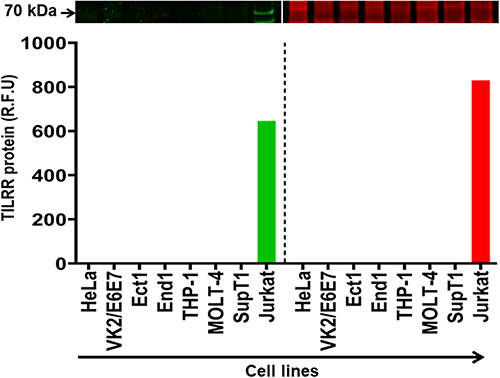
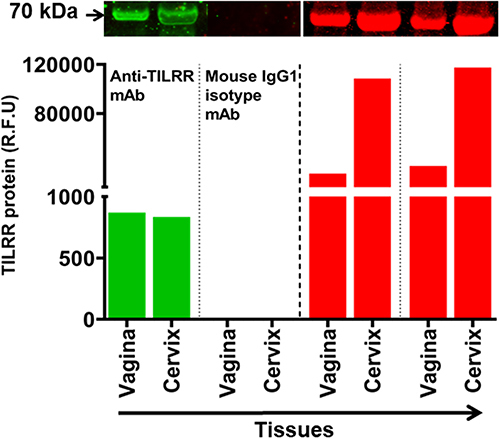
Figure 5 Anti-TILRR mAb is specific for TILRR protein. Tissues lysates (2.5 µg/lane protein) (n=2) were examined by Western blot (green color, left) and Coomassie blue staining (red color, right). TILRR protein was probed by either primary mouse anti-TILRR F218G4 mAb or primary mouse IgG1 mAb (isotype control) (Abcam, Canada) followed by secondary goat anti-mouse IRDye 800CW antibody (1:10,000; LI-COR). TILRR protein bands (70 kDa, green color, cropped) are shown on the top of the bar graph (see Figure S4A for un-cropped blot image). Untransferred proteins in the gel after iBlot transfer were stained with Coomassie blue staining (G-250, Bio-Rad), and the protein bands (~70 kDa, red color, cropped) are shown on the top of the bar graph (see Figure S4B for un-cropped gel). The bar graph shows the TILRR protein intensity (R.F.U) for each tissue lysate where X-axis represents human tissue lysates and Y-axis indicates the signal intensity (R.F.U). kDa, kiloDalton; RFU, relative fluorescence units.