Figures & data
Table 1 Basic Information of the Three Microarray Datasets from GEO
Table 2 Basic Characteristics of the Top Ten DEcircRNAs
Table 3 Primer Sequences of circRNA, miRNAs, mRNAs for RT-qPCR
Figure 1 Flowchart of the study.
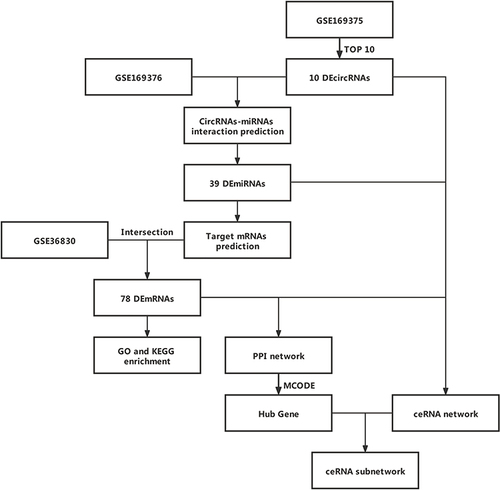
Figure 2 Differentially expressed circRNAs, miRNAs and mRNAs in CRSwNP subjects compared with control subjects. (A) Volcano map for all DEcircRNAs from GSE169375. (B) Heatmap of the top 50 DEcircRNAs from GSE169375. (C) Volcano map for all DEmiRNAs from GSE169376. (D) Heatmap of the top 50 DEmiRNAs from GSE169376. (E) Volcano map for all DEmRNAs from GSE36830. (F) Heatmap of the top 50 DEmRNAs in GSE36830.
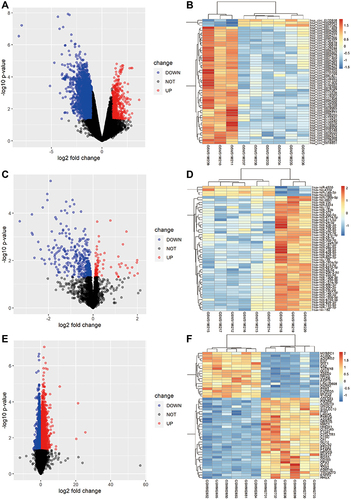
Figure 3 The ceRNA network of circRNA/miRNA/mRNA in CRSwNP. Red dots represent circRNAs. Green dots indicate miRNAs. Blue dots indicate mRNAs.
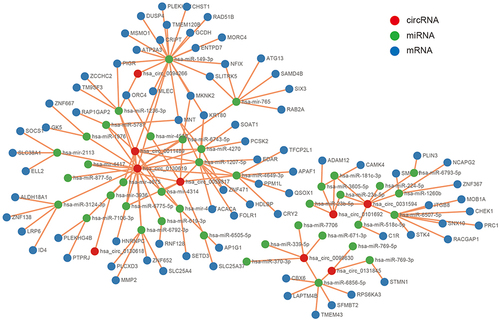
Figure 4 GO and KEGG analyses of 78 DEmRNAs. (A) GO analysis. (B) KEGG pathway analysis.
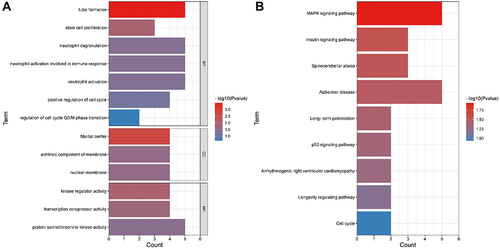
Figure 5 PPI network, hub genes, and circRNA/miRNA/mRNA subnetwork for hsa_circ_0031594. (A) PPI network of 78 DEmRNAs. (B) Four hub genes extracted from the PPI network based on the MCODE algorithm. (C) The circRNA/miRNA/mRNA axes of hsa_circ_0031594.
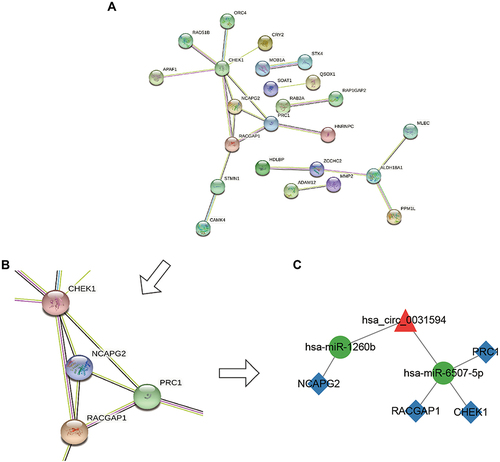
Figure 6 The factor expression levels and diagnostic values of core subnetwork, and correlation analysis in CRSwNP. (A–E) Confirmation of the expression of hsa_circ_0031594, hsa-miR-1260b, hsa-miR-6507-5p, NCAPG2, and PRC1 in the subnetwork using RT-qPCR (CRSwNP (n=14); control subjects (n=14). *P < 0.05, **P < 0.01, ***P<0.001. (F and G) Confirmation of the expression of RACGAP1 and CHEK1 in the subnetwork using RT-qPCR (CRSwNP (n=7); control subjects (n=7)). (H–L) ROC curves for testing the hsa_circ_0031594, hsa-miR-1260b, hsa-miR-6507-5p, NCAPG2 and PRC1 by RT-qPCR. (M) The correlation between hsa_circ_0031594 and hsa-miR-1260b (Spearman correlation coefficient = −0.55, p = 0.003). (N) The correlation between hsa_circ_0031594 and hsa-miR-6507-5p (Spearman correlation coefficient = −0.58, p = 0.001). (O) The correlation between hsa_circ_0031594 and NCAPG2 (Spearman correlation coefficient = 0.60, p = 0.001). (P) The correlation between hsa_circ_0031594 and PRC1 (Spearman correlation coefficient = 0.47, p = 0.011).
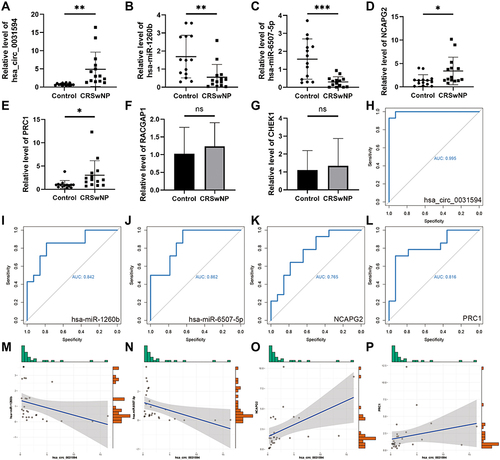
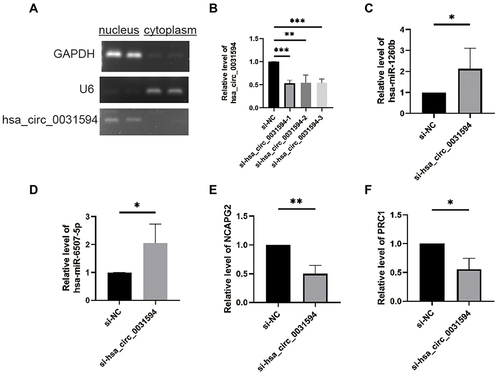
Figure 7 Knocking down hsa_circ_0031594 affected the expression of hsa-miR-1260b, hsa-miR-6507-5p, NCAPG2, and PRC1. (A) The subcellular localization of hsa_circ_0031594 in human nasal epithelial cells HNEpC. (B) SiRNAs obviously knocked down hsa_circ_0031594 expression. **P < 0.01, ***P < 0.001. (C and D) Knocking down hsa_circ_0031594 obviously increased the hsa-miR-1260b and hsa-miR-6507-5p expression. *P < 0.05. (E and F) Knocking down hsa_circ_0031594 obviously reduced the NCAPG2 and PRC1 expression. *P < 0.05, **P < 0.01.