Figures & data
Table 1 The Primer Sequence for qRT-PCR
Figure 1 Quality control of the lncRNAs. (A) Prediction of lncRNAs from four softwares. (B) Classification of lncRNAs in the samples. (C) Expression level of lncRNAs in two groups. (D) Density of lncRNAs in two groups. (E) The cumulative distribution of conservative scores for lncRNA and mRNA. (F) Conservative score cumulative distribution. (G) Conservative score probability density curve.
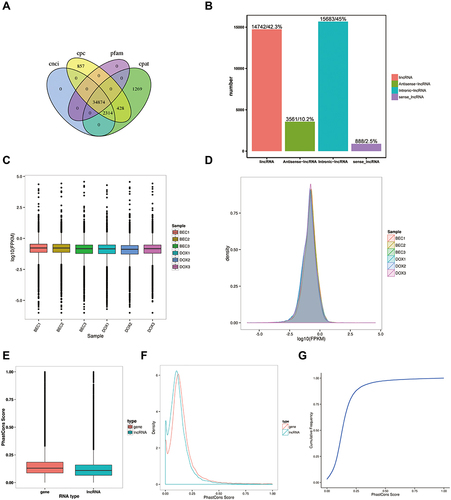
Figure 2 The difference expression of lncRNAs analysis. (A) The correlation analysis between the DOX group and BEC group. (B) The volcano plot of up- and downregulated lncRNAs in BEC group compared with DOX group. (C) The hierarchical clustering and difference of lncRNAs between the two groups.
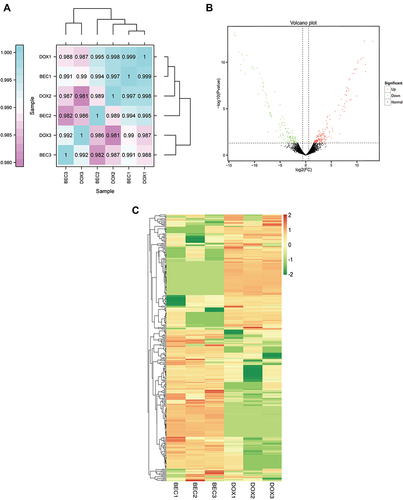
Table 2 The Top 10 ElncRNAs in the BEC Group
Figure 3 The GO enrichment analysis of cis_targets of ElncRNAs. (A) Enrichment analysis of biological process (BP) of cis_targets. (B) Enrichment analysis of cellular component (CC) of cis_targets. (C) Enrichment analysis of molecular function (MF) of cis_targets.
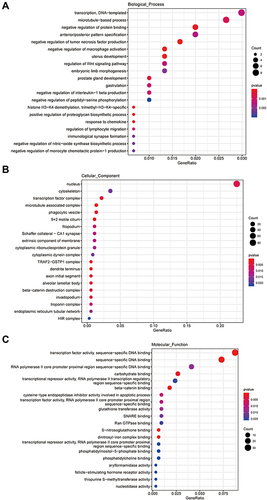
Figure 4 The KEGG analysis of cis_targets of ElncRNAs. (A) The enrichment of pathways of cis_targets. (B) The whole outlook of enriched pathways, including cellular process, environmental processing, genetic information processing, human diseases and original systems, of cis_targets.
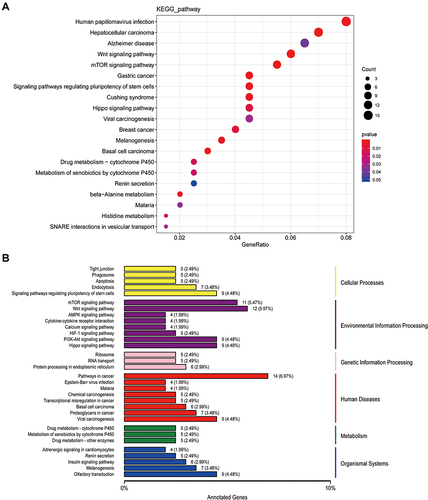
Figure 5 The crucial signaling pathways. (A) The chemokine signaling pathway. (B) The cellular senescence signaling pathway. (C) The mTOR signaling pathway. (D) The p53 signaling pathway.
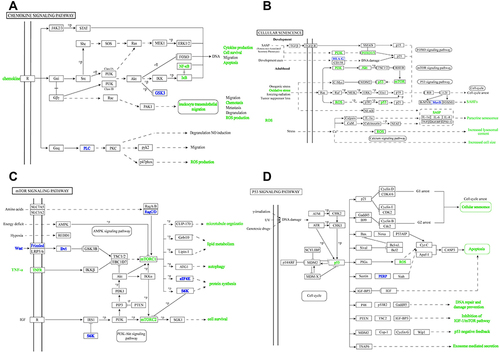
Figure 6 The cell verification experiments. (A) The CCK-8 assay. (B) The ROS experiment (The scale bar is 100μm). (C) The relative expression of IL-6 in each group. (D) The relative expression of MSTRG.75967.15 in each group. (E) The relative expression of MSTRG.51708.15 in each group. (F) The relative expression of MSTRG.98097.4 in each group. (G) The relative expression of ENSMUST00000162380 in each group. (H) The relative expression of MSTRG.94952.19 in each group. (I) The relative expression of MSTRG.4585.1 in each group. (J) The relative expression of MSTRG.79460.7 in each group. (K) The relative expression of MSTRG.38414.10 in each group. (L) The relative expression of MSTRG.58791.2 in each group. (M) The relative expression of MSTRG.12633.8 in each group. (ns, p > 0.05; *p < 0.05; **p < 0.01; ***p < 0.001; ****p < 0.0001.).
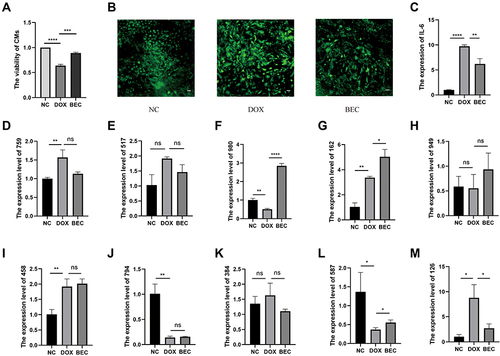
Table 3 The Target Genes of MSTRG.58791.2 and MSTRG.98097.4
Figure 7 The lncRNA-mRNA network between two candidate lncRNAs and their target genes. (A) The common target genes of MSTRG.58791.2 and MSTRG.98097.4. (B) The network and core genes involving in DIC.
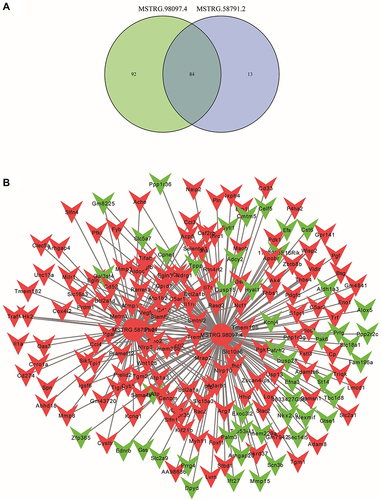
Figure 8 The verification experiments in vivo. (A) Exosomes photographed by transmission electron microscopy (TEM). (B) The nanoparticle diameter identified by NTA. (C) The schematic design of animal experiment. (D) The survival rate of different groups (p<0.05). (E) The Sirius Red Staining. (F) The relative expression of IL-1β. (G) The relative expression of IL-6 in each group. (H) The relative expression of MSTRG.58791.2 in each group. (I) The relative expression of MSTRG.98097.4 in each group. (*p < 0.05; **p < 0.01; ***p < 0.001; ****p < 0.0001).
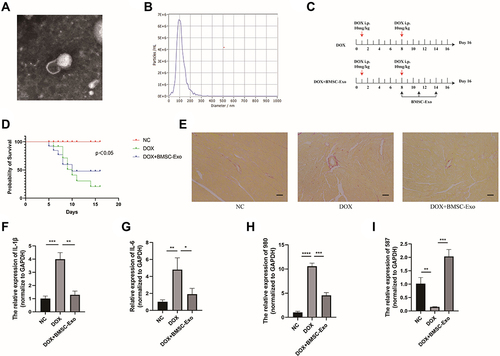
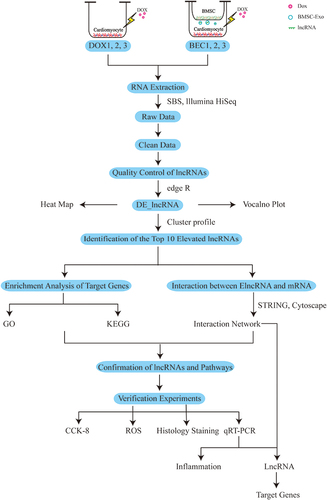
Figure 9 The whole process of the study.