
Figures & data
Figure 1 (A–D) HMRECs subjected to high glucose (30mM) and supplemented with adiponectin (30µg/mL) for 24 hours were analyzed for apoptosis (A) and ROS (B). Data were presented as bars and expressed as mean ± SEM. *p≤0.05; HG is significantly different from the control, APN, and Mannitol groups. Φ p≤0.05; HG is significantly different from the HG+ adiponectin (HG+APN) group. (C) Relative changes in immunofluorescence intensity expressed as Mean Fluorescence Intensity. (D) A representative of RSN protein expression of NO in HMRECs exposed to different treatments: 30mM high glucose and adiponectin treatment (30µg/mL) for 24 hours in HMRECs exposed to 30mM glucose (HG+APN). Data were presented as bars and expressed as mean ± SEM. *p≤0.05; HG is significantly different from the control (NG) group. Φp≤0.05; HG is significantly different from the HG+ APN group. DAF-FM Diacetate (see methods) was utilized to detect RSN. Data represent 3–5 independent experiments. Statistical differences were established using the Student’s t-test with a two-tailed p < 0.05.
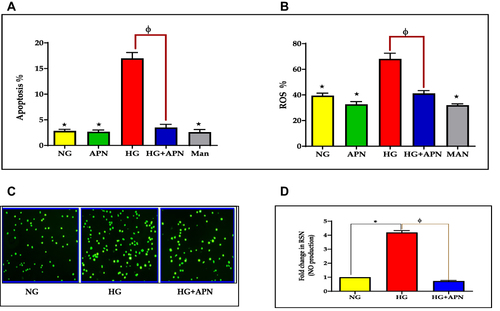
Figure 2 (A–D) Quantification of APN receptors, inflammatory mediators and adhesion molecules. (A) Quantification of mRNA level using ADR1 and ADR2 against B-actin by RT-PCR expressed as means ±SEM of 3-5 independent experiments analyzed by one-way ANOVA and post-hoc multiple comparison tests. * p≤0.05; HG is significantly different from the control, and APN groups. Φ p≤0.05; HG is significantly different from the HG+APN group. Two-tailed P value is significant at p≤0.05. (B): Adiponectin dissuades pro-inflammatory cytokines (TNF-alpha and IL-1B) and chemokine (IL-8) proteins. Data represent the Mean and SEM of NG, HG (30mM), and the hyperglycemic group treated with adiponectin (HG+APN). Data represent 3-5 independent experiments. The two-tailed p-value is significant at p <0.05. (C and D): Adiponectin reduces the production of ICAM-1 (C), and E-selectin (D) adhesion molecules. A representative flow cytometry of the protein expression of ICAM-1 (CD 54) and E-selectin (CD 62) in HMRECs exposed to different treatments are displayed in the left panel of Fig C and Fig D, respectively. Bars in Figures C and D show the data presented as Means ±SEM of 2-3 independent experiments analyzed by one-way ANOVA followed by post-hoc multiple comparison tests for ICAM-1 (CD 54), and E-selectin (CD 62), respectively. Two-tailed P value is significant at p≤0.05. *** P≤0.0005 is significant, **** P <0.0001 is significant.
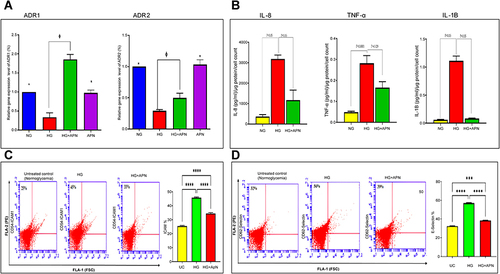
Figure 3 (A–E) Functional assays. (A) Adiponectin attenuates leukocyte migration. Data presented as Absorbance at 450 nm and a mean ±SEM of 3–4 independent experiments performed by the Endothelial Cell Migration Assay Kit. (B) Characterization of trans-electrical resistance (TER) of HMRECs exposed to different treatment: normoglycemia (NG), high glucose concentration (30mM) (HG), and adiponectin treatment to HG group (HG+APN). (C) Bars show the significance of resistance (barrier function) changes between the different treatment groups presented as mean and SEM. *p <0.05 HG is significantly different from the NG group. Φ p<0.05 HG is significantly different from the HG+APN group. Abbreviations, Normoglycemia cells (NG); High Glucose (HG); and High Glucose +adiponectin (30µg/mL) (HG+APN). Stat analysis was performed by ANOVA (one-way) followed by Dunnett post hoc test for multiple comparison. Data represent 3–4 independent experiments. (D and E) A representative of preventive impact of adiponectin on tube formation of HMRECs exposed to normoglycemia (control), high glucose concentration (30mM) (HG), and adiponectin treatment to HG group (HG+ APN). (E) Bars show the tube formation changes between the different treatment groups presented as mean and SEM. Data represent 3–4 independent experiments.*p <0.05 HG is significantly different from the control group. Φ p<0.05 HG is significantly different from with HG+ APN group. Two talied p value is signficantly less than 0.05.
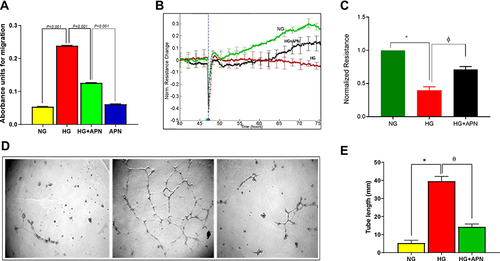
Figure 4 (A–C) Canonical pathways by IPA core analysis. (A) Histogram displays the most relevant canonical pathways (p <0.05) involved in the response of HRMECs cells to APN treatment. The rank was based on the log p-value, the ratio of genes of the dataset compared to the knowledge base of IPA. See supplementary tables for details. (B) Bars display the values of Z- activation of the most relevant canonical pathways. (C) Network displays the HMGB1 pathway cascade and involves the downstream genes that are differentially expressed; downregulated as the green color and upregulated as red color, labeled with values of fold changes, and their role in biological process.
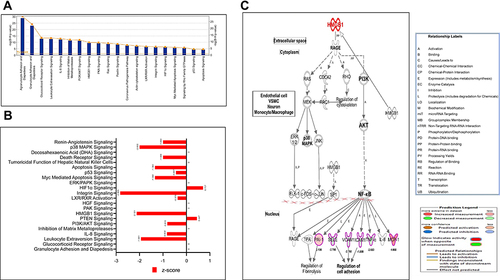
Figure 5 (A-D) Classification of diseases and functions. Figure (A) Bars represent categories are shown in terms of the -log (P-value), as represented by the left y-axis and the diseaes and functions categories represented by the x-axis. A total of 21 representative classifications of diseases and functions of the dataset are differentially expressed genes in HRMECs cells in response to APN. Figure (B) Heatmap represents the classification of diseases and functions. This heatmap was drafted according to its Z-score values, where higher Z-scores represented by Orange indicate activation, while lower Z-scores represented by blue indicate inhibition. Figures (C and D) Network association displays the upregulated (red) and downregulated (green) genes and canonical pathways (CP) involved in apoptosis (C) and production of reactive oxygen species (D) of HRMECs treated with APN. See legends for details, which indicate activation, inhibition, not consistent, and not predicted functions. The yellow arrow indicates increased prediction; the blue arrow indicates decreased prediction, and the gray arrow has no known predicted effects. The lower Z-scores represented by blue indicate inhibition for apoptosis and production of reactive oxygen species. See legends for details.
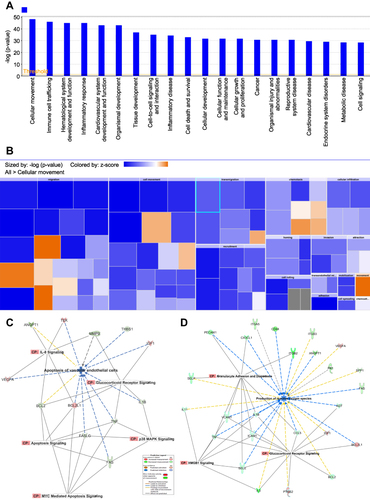
Figure 6 (A–F): functions related to pathogenesis. The most important functions are involved in the response of HRMECs to APN treatment. Networks display the upregulated (red) and downregulated (green) genes involved in chemotaxis (A), adhesion of VEC (B), adhesion of granulocytes (C), migration of leukocytes (D), inflammatory response (E), and angiogenesis (F) in HRMECs in response to APN. The Yellow arrow indicates increased prediction, the Blue arrow indicates decreased prediction, and the Gray arrow has no known predicted effects. See legends and results for details.
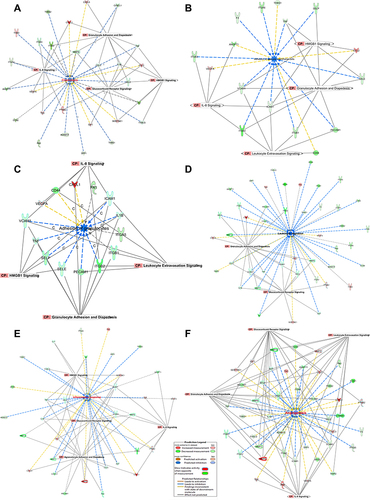
Table 1 Master Regulator Transcription Regulators in HMRECs in Response to APN That Affect the Expression of the Genes of the Present Study’s Data Set with Their p-values, Z-Score, and Target Molecule. (Based on Core Analysis in Ingenuity Pathway Analysis (IPA)
Table 2 Master Regulator Kinases in HMRECs in Response to APN Affect the Expression of the Genes of the Present Study’s Data Set with Their p-values, Z-Score, and Target Molecule. (Based on Core Analysis in Ingenuity Pathway Analysis (IPA)
Table 3 Master Regulator of miRNA in HMRECs in Response to APN That Affects the Expression of the Genes of the Data Set of the Present Study with Their p-values, Z-Score, and Target Molecule. (Based on Core Analysis in Ingenuity Pathway Analysis (IPA)
Figure 7 Upstream regulators network. (A) STAT3 TF and mechanistic NW: Network displays STAT3 as a direct upstream regulator targeting two important genes: ICAM-1 and IL1B, downregulated (green). The mechanistic network displays the other TFs interconnected with STAT3 as an indirect mechanism affecting ICM-1 and IL1B gene expression, including JUN, JUNB, NFKB1, and NFKBIA RELA, ERK1/2, FOS, Ap1, SP1, TP53, and CEBPB. The lower Z-scores represented by blue indicate inhibition, while higher Z-scores represented by Orange indicate activation. The yellow arrow indicates increased prediction, the blue arrow indicates decreased prediction, and the gray arrow has no known predicted effects. See legends for details, for the relationship label and prediction legend. (B) IKBKB kinase and mechanistic NW: The network displays IKBKB kinase as a direct upstream regulator that targets two important genes: VCAM-1 and TNF, which are downregulated (green). The mechanistic network displays the other TFs interconnected with IKBKB as an indirect mechanism affecting the gene expression of VCAM-1 and TNF, including JUN, JUNB, NFKB1, NFKBIA, RELA, ERK1/2, FOS, Ap1, SP1, ERK1/2, andIRF1. The lower Z-scores represented by blue indicate inhibition, while higher Z-scores represented by Orange indicate activation. The yellow arrow indicates increase prediction, the blue arrow indicates decreased prediction, and the gray arrow has no known predicted effects. See legends for details, for the relationship label and prediction legend. (C) miRNA8 and mechanistic NW: Network displays mir8 as a direct upstream regulator, which targets four important genes, which are CTNNB1, BCL2, MMP1, TIMP2, which are downregulated (green). The mechanistic network displays that mir8 like other TFs such as Wnt receptor and AKT kinase, which through the indirect mechanism affecting other gene expressions of CD44, TNF, SPP1, MMP-9, VEGFA, PTGS2, CCL2, FN1, BCL2L1which include JUN, JUNB, NFKB1, NFKBIA, RELA, ERK1/2, FOS, Ap1, SP1, ERK1/2, and IRF1. Other genes affect Akt, such as F3, FASLG, THBS2, MMP14, and VACM1. The lower Z-scores represented by blue indicate inhibition, while higher Z-scores represented by orange indicate activation. The yellow arrow indicates increase prediction, the blue arrow indicates decreased prediction, and the gray arrow has no known predicted effects. See legends for details, for the relationship label and prediction legend.
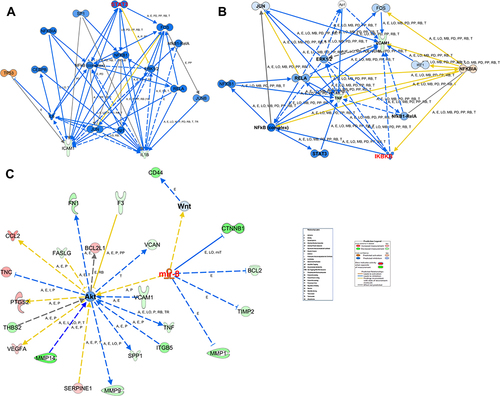
Figure 8 Biological network. (A) The figure displays 9 molecular networks which are ranked based on the score, number of molecules involved whether the DEGs of the data set (focus), and other molecules provided by the IP knowledge base (non-focus) to complete the biological process and molecular function and demonstrates the top functions and diseases of each network. (B) Network shows interactions between dysregulated genes, functions, and upstream regulators in response of HRMECs cells to APN treatment. The figure illustrated the molecules and pathways involved in suppressing angiogenesis and adhesion of EC functions in response to APN treatment to HG cells. The network analysis displayed that the following focus (BCL2L1, BCL2, COL4A2, FAS, FASLG, FN1, IL1B, MMP14, PECAM1, PTGIS, PTGS2, TEK, THBS1, VCAM1, VEGFA) and non-focus molecules which added by IPA knowledge base, (DISC or CASP8, FAK, NFkB complex, PI3k p85, STAT, Ubiquitin, 26s Proteasome, Calcineurin protein, Histone h3, IFN-α, P glycoprotein, SYK/ZAP, ATPase, 14-3-3 “CBP,” caspase, Hsp90, P38 MAPK, Ikb, Nfat, RAS). The top annotated diseases and functions are cancer, cell death, survival, and organismal injury and development. In addition, the network displays the canonical pathway involved in angiogenesis and adhesion of EC related to the glucocorticoid receptor signaling pathway. The upregulated (red) and downregulated (green) are illustrated. See legends for details, for the relationship label and prediction legend.
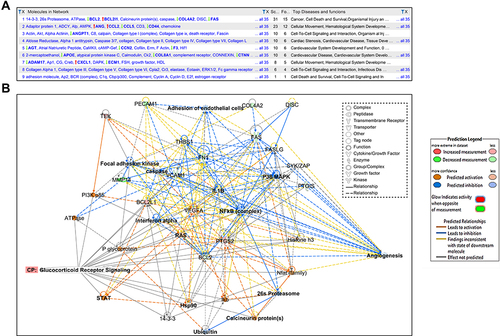
Table 4 Categories of Functions and Diseases in Network 1, Indicating p-value, and Molecules Involved and Their Numbers/Each Function or Disease
Table 5 Categories of Functions and Diseases Annotations in Network 2, Indicating p-value, and Molecules Involved and Their Numbers/Each Function or Disease
Table 6 Categories of Functions and Diseases Annotations in Network 3, Indicating p-value, and Molecules Involved and Their Numbers/Each Function or Disease