Figures & data
Figure 1 The schematic illustration of experimental design.
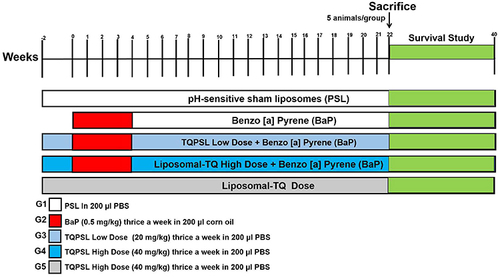
Figure 2 Characterization and in vitro stability and release kinetics of TQPSL.
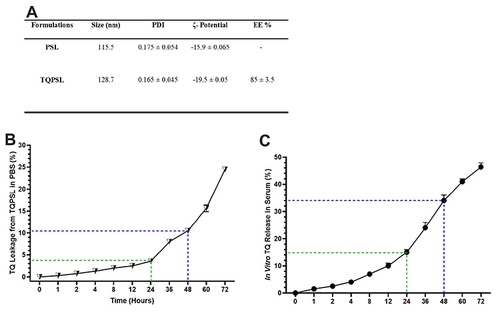
Figure 3 Effect of TQPSL on BaP-modulated average body weight, survival and ROW.
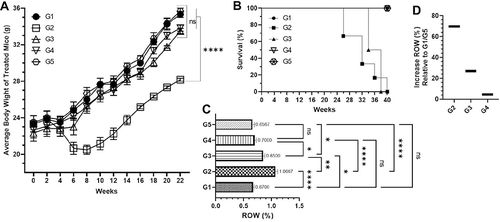
Figure 4 Effect of TQPSL on cancer marker enzymes in the serum.
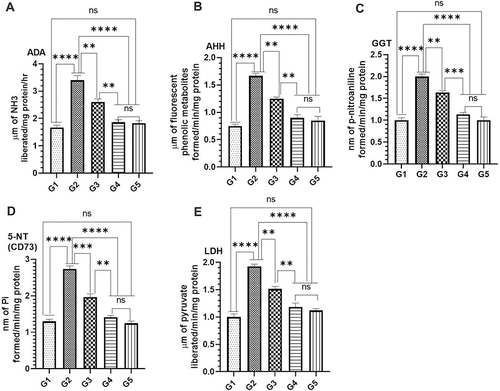
Figure 5 Continued.
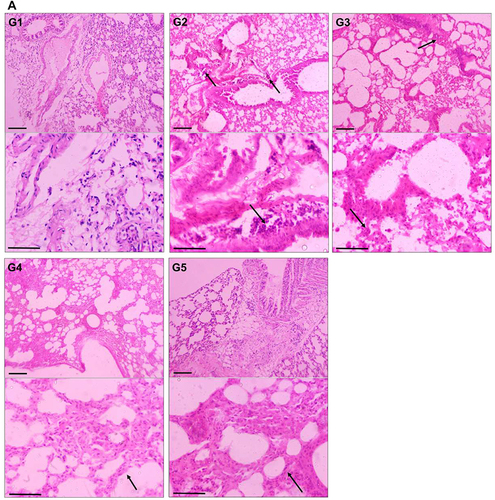
Figure 5 Effect of TQPSL on the histopathology of lungs and liver.
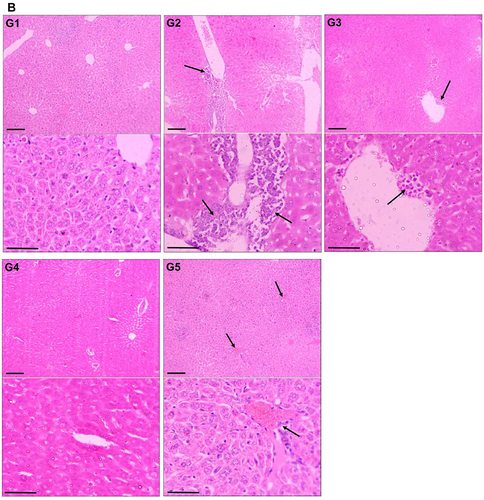
Figure 6 Effect of TQPSL on the level antioxidant enzymes in lung tissues.
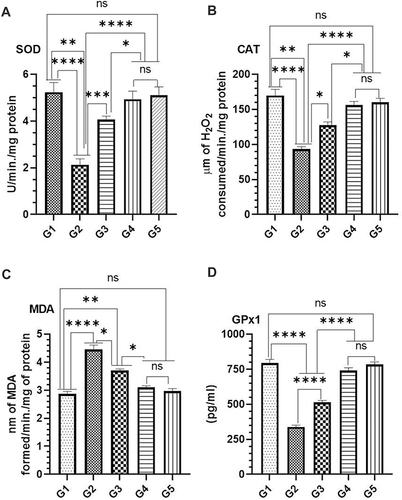
Figure 7 Effect of TQPSL on the induction of apoptosis in the lung cells by Annexin V-FITC-PI using flow cytometry in the lungs.
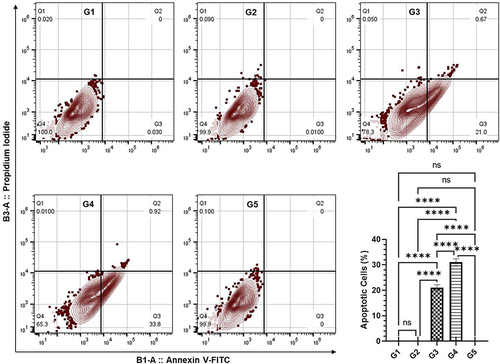
Figure 8 Effect of TQPSL on BaP-induced intracellular ROS by DCFDA using flow cytometry in the lungs.
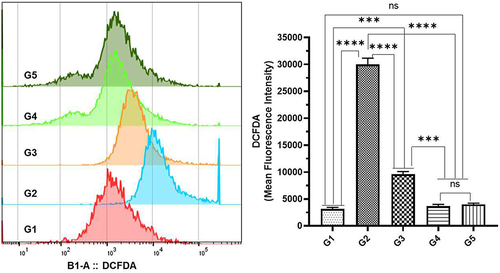
Table 1 AutoDock Vina Results of TQ with Potential Anticancer Drug Targets
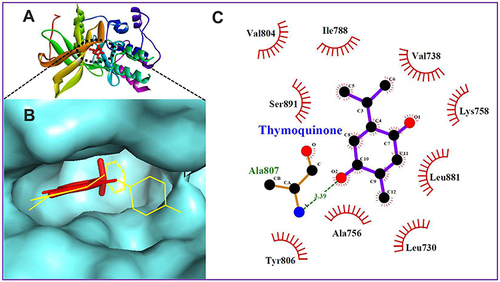
Figure 9 (A) Minimum energy conformation of the docked thymoquinone (shown as red sticks) in the binding pocket of BRAF protein showing hydrogen bond interaction as yellow lines. (B) Co-crystallized inhibitor of the BRAF protein (PDB ID: 6P7G), 3-[(imidazo[1,2-b] pyridazin-3-yl)ethynyl]-4-methyl-N-[4-({[2-(morpholin-4-yl)ethyl]amino}methyl)-3-(trifluoromethyl)phenyl]benzamide, occupying the binding site.
![Figure 9 (A) Minimum energy conformation of the docked thymoquinone (shown as red sticks) in the binding pocket of BRAF protein showing hydrogen bond interaction as yellow lines. (B) Co-crystallized inhibitor of the BRAF protein (PDB ID: 6P7G), 3-[(imidazo[1,2-b] pyridazin-3-yl)ethynyl]-4-methyl-N-[4-({[2-(morpholin-4-yl)ethyl]amino}methyl)-3-(trifluoromethyl)phenyl]benzamide, occupying the binding site.](/cms/asset/0b1094ad-4448-4312-971d-54e2936d545d/djir_a_12158284_f0009_c.jpg)
Figure 10 (A and B) Docking conformation TQ in the RET protein (shown as ribbon and surface style in (A and B), respectively). Superimposition of the docked TQ (shown as red stick) and native co-crystallized inhibitor of the RET protein (shown as yellow line in (B). (C) LigPlot diagram of the docked TQ.