Figures & data
Figure 1 Experimental protocol of DSS-induced ulcerative colitis mice.
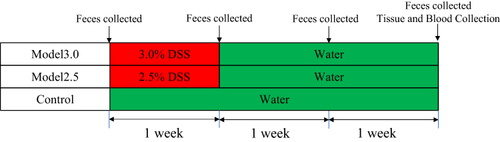
Table 1 Scoring Criteria of Disease Activity Index (DAI) in UC Mice
Table 2 Scoring Criteria of Histopathological in UC Mice
Figure 2 General condition of DSS-induced ulcerative colitis mice. (A) Mice survival was monitored daily. (B) The body weight of mice was measured once daily. (C) The DAI score was calculated by measuring the clinical score of body weight change, stool, and fecal occult blood. The graphs are represented as mean±SD. *,#p<0.05, **,##p<0.01. *Control and model 2.5. #Control and model 3.0.
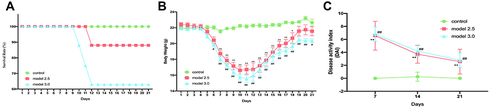
Figure 3 Colons tissue of the proximal and distal colon sections were stained with H&E, and the histological images were obtained through an optical microscope. Histopathological scores of inflammation cell infiltration, depth of lesions, destruction of crypts, width of lesions, and crypt damage were measured. The graphs are represented as mean ±SD. *p<0.05, #p<0.01. *Control and model 2.5. #Control and model 3.0.
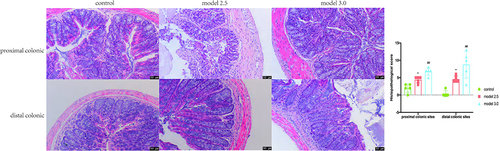
Figure 4 Levels of inflammatory cytokines was measured by ELISA in DSS-induced ulcerative colitis. (A) The level of inflammatory cytokines such as IL-2, IL-4, IL-6, IL-10, IL-22, or 5-HT from the serum of the mice. (B) The level of inflammatory cytokines such as IL-2, IL-4, IL-6, IL-10, IL-22, TNF-α, IFN-γ, or 5-HT from the colon of the mice. The graphs are represented as mean ±SD. *p<0.05, **p<0.01 and ***p<0.001.
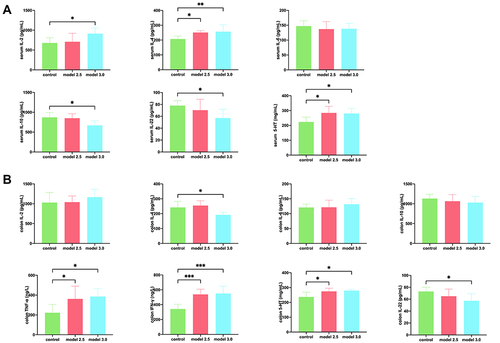
Figure 5 DSS changed the structure of gut microbiome in UC model mice. (A) Rarefaction/Shannon curve indicates the amount of sequencing data is large enough to reflect the true level of bacterial diversity. (B) Pan/core analysis shows the amount of sequencing data is reasonable. (C) Venn diagram (OTU and genus) analysis notes DSS could reduce the richness of bacterial community. (D) Beta-diversity analyses illustrates the gut microbiome composition of different groups differed at different time points.
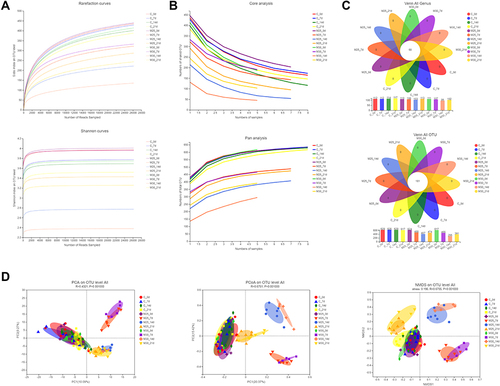
Figure 6 Differential gut microbiome results. (A and B) The difference genera of intestinal flora in mice at phylum (A) and genus (B) levels at different time points was analyzed. The graphs are represented as mean±SD. *,#p<0.05, **,##p<0.01. *Control and model 2.5. #Control and model 3.0.
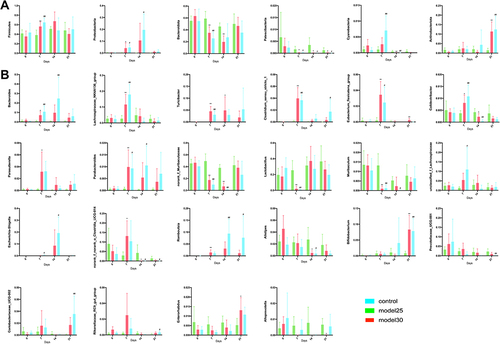
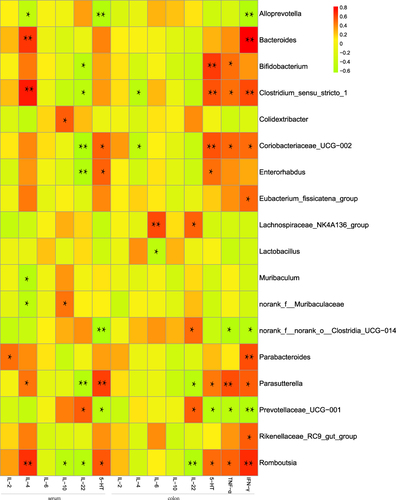
Figure 7 Heatmap of correlation analysis between gut microbiome and inflammatory cytokines in UC mice. Spearman’s rank correlation coefficient is indicated using a color gradient: red indicates positive correlation; green indicates negative correlation,*p<0.05, **p<0.01.