Figures & data
Table 1 Patients` Demographic and Clinical Characteristics
Table 2 Sequences of Used Primers and Expected Product Sizes
Figure 1 Effect of different cytokines on IDO mRNA expression and kinetics of chosen proteins expression by human BMMC. (A) Effect of cytokines stimulation on IDO mRNA expression in RA and OA BMMC. Data are presented as the mean ± SEM (n = 3 in OA and n = 3 in RA patient groups, shown together). Differences between different stimuli and control were analyzed by Wilcoxon test; * p < 0.05. C (control) – cells cultured alone in culture medium, concentrations of used compounds: CTLA-4-Fc (1 or 4 μg/mL), IFN- γ (0.1-1-10 ng/mL), IL-15 (10 ng/mL), IL-17 (10 ng/mL), TNF (10 ng/mL), IL-6 (5 ng/mL), IL-1β (1 ng/mL). (B) Expression of IDO, TTS, IFN-γ and (C) IL-15, IL-15R mRNA was analyzed using RT PCR on human BMMC treated with CTLA-4-Fc in 4h intervals. Representative mean values of three independent experiments (BMMC from one RA patient and two OA patients) ± SEM are shown. IDO, indoleamine 2,3-dioxygenase; TTS, tryptophanyl-tRNA-synthetase; IFN-γ, interferon gamma; IL-15, interleukin-15; IL-15R1/2, interleukin-15 receptor α (isoform 1/2).
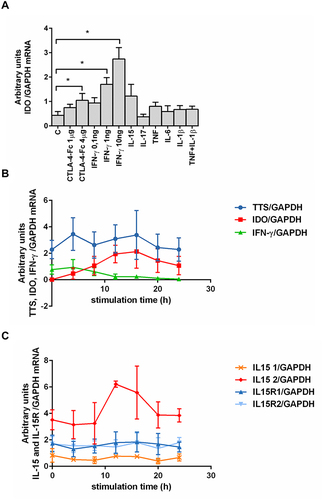
Figure 2 CTLA-4-Fc inhibition of PHA-induced CD4+ T-cell activation by the IDO-dependent mechanism. (A) Expression of CD69 was detected on CD3+CD4+ T cell population from BMMC stimulated by PHA in the absence or presence of CTLA-4-Fc and/or IDO inhibitor, 1-methyl-DL-tryptophan (1-MT) by flow cytometry. The results are presented as the mean ± SEM (n = 4 in OA and n=4 in RA patient groups, shown together). Comparison of groups was analyzed by Wilcoxon test; ** p < 0.01, ns – not significant. (B) Representative gating strategy and staining are shown for OA and RA BM CD4+ cells respectively. The numbers depicted on dot plots show the frequencies of the subset expressing proper marker. C (control) – cells cultured alone in culture medium.
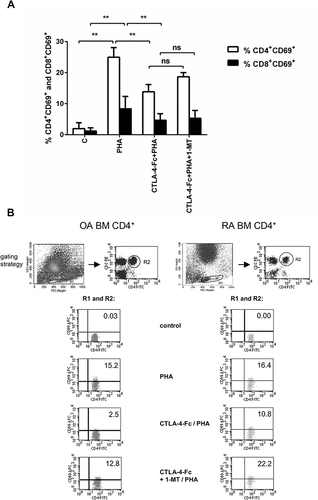
Figure 3 Modulation of CD69 expression by CTLA-4-Fc on CD4+ T-cells activated with anti-CD3. (A) Percentage of the CD3+CD4+CD69+ cells and (B) the mean expression of CD69 were investigated on cells from BM stimulated by anti-CD3 in the absence or presence of CTLA-4-Fc by flow cytometry. The results are presented as mean ± SEM (n = 4 in OA and n = 4 in RA patient groups, shown together). (C) Expression of CD69 were measured on CD3+CD4+ T cell population from PBMC stimulated by anti-CD3 in the absence or presence of CTLA-4-Fc. The results are shown as mean ± SEM of four independent experiments, using cells from two OA and two RA patients, shown together. (D) Induction of CD69 by anti-CD3 stimulation was compared on RA BMMC, OA BMMC (n = 4 in OA and RA patient groups, shown separately) and paired PBMC. (E) The gating strategy and representative staining are shown for OA BM CD4+ and OA PBMC CD4+ cells respectively. The results are shown as the mean ± SEM. Comparison of all groups was analyzed by Wilcoxon test; ** p < 0.01, ns – not significant, C (control) – cells cultured alone in culture medium.
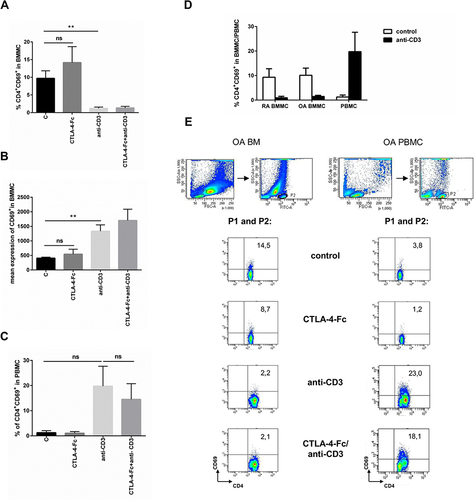
Figure 4 The effect of anti-CD3 stimulation on CD25 and Foxp3 expression on CD4+ T cells from BM. (A) Percentage of the CD4+CD25+ and (B) CD4+Foxp3+ cells were estimated among BMMC stimulated by anti-CD3 by flow cytometry. The results are presented as mean ± SEM (n = 4 in OA and n=4 in RA patient groups, shown together). Comparison of groups was analyzed by Wilcoxon test, * p < 0.05; ns – not significant. (C) The gating strategy and representative staining are shown for OA and RA BMMC respectively. The numbers depicted on the dot plots show the frequencies of the subset expressing the proper marker. C (control) – cells cultured alone in culture medium.
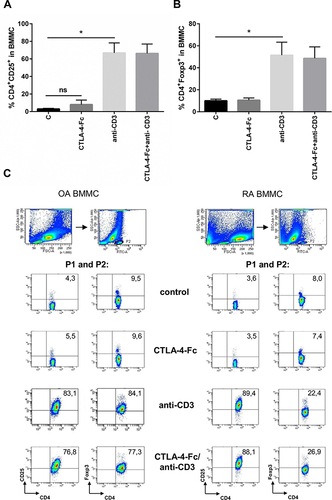
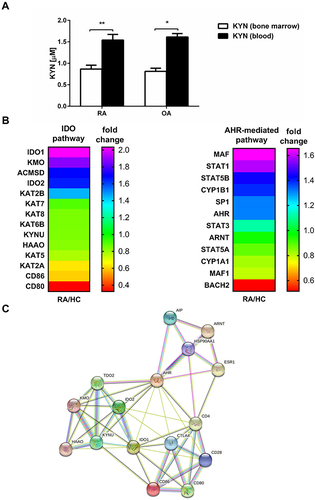
Figure 5 IDO activity in BM and periphery. (A) The kynurenine concentration was measured in BM plasma and blood plasma (obtained from the same patient) by HPLC as described in Materials and Methods. The results are presented as the mean ± SEM (n = 6 in OA and n = 8 in RA patient group). Comparison of the results were analyzed by Wilcoxon test; ** p < 0.01; * p < 0.05. (B) Heatmap of selected gene expression of IDO- and AHR-mediated pathways in RA and HC blood monocytes (n = 4 in RA and n = 4 in HC). (C) Network of protein–protein interactions (PPI) involved in IDO and AHR-mediated pathways analyzed by STRING database. IDO - indoleamine 2,3-dioxygenase; AHR - Aryl hydrocarbon receptor.