
Figures & data
Table 1 Basic Information of Gene Expression Profiling
Figure 1 The comparison of the microenvironment score in normal samples and epilepsy samples. (A) Immune score in GESM sets. (B) Stromal score in GESM sets. (C) Immune score in GSE16969 sets. (D) Stromal score in GSE16969 sets. *p < 0.05, and **p ≤ 0.01.
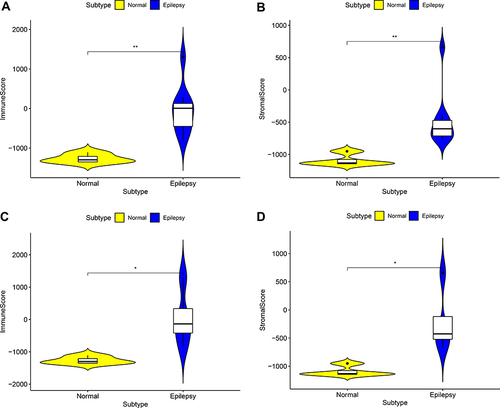
Figure 2 (A) UpSet plot presents the intersection of three datasets. (B) The location of differentially expressed immune-related genes (DEIRGs) on 23 chromosomes.
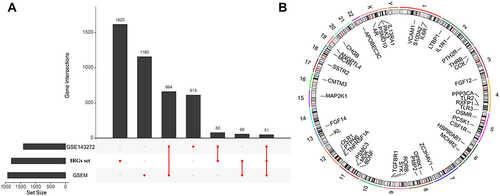
Figure 3 Functional enrichment analysis of differentially expressed immune related genes (DEIRGs) in GSEM + GSE143272 datasets. (A) Gene ontology (GO) analysis on biological process (BP), cellular component (CC), and molecular function (MF). (B) Kyoto Encyclopedia of Genes and Genomes (KEGG) pathways.
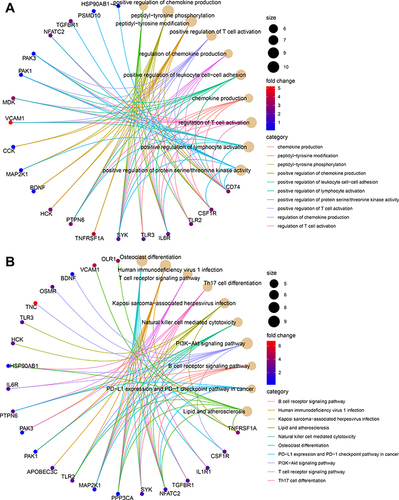
Figure 4 Random forest (RF) algorithm to screen hub genes in GSEM + GSE143272 datasets. (A) Distribution diagram of regression tree and error. (B) The top 30 most important variables ranked by IncNodePurity.
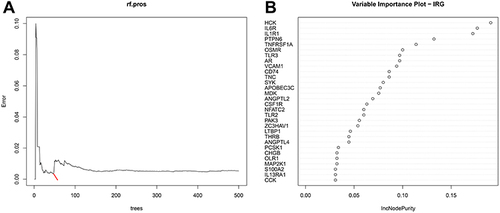
Figure 5 (A) The top 30 DEIRGs ranked by the number of nodes based on the PPI network. (B) UpSet plot present the intersection of six methods (Betweenness (top 15), Degree (top 15), MCC (top 15), PPICount (top 20), DiffGs (top 20), and RF (top 20)).
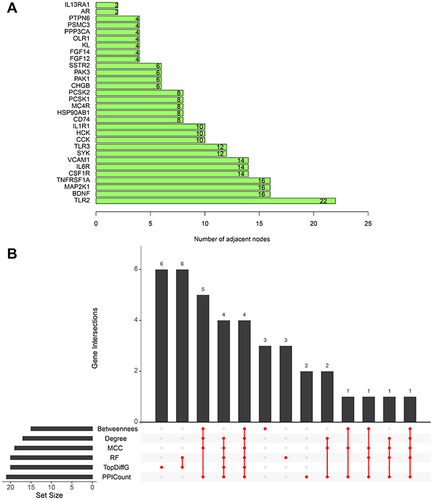
Figure 6 (A) The receiver operating characteristic (ROC) curves of the diagnostic efficacy from combined hub genes in GSE31718 dataset. (B) Correlation between combined hub genes and epileptic frequency. (C–F) Verification of hub genes via qRT-PCR on blood PBMCs - Comparison of gene expression levels of 4 hub genes between controls and epilepsy samples. *p < 0.05, and **p ≤ 0.01.
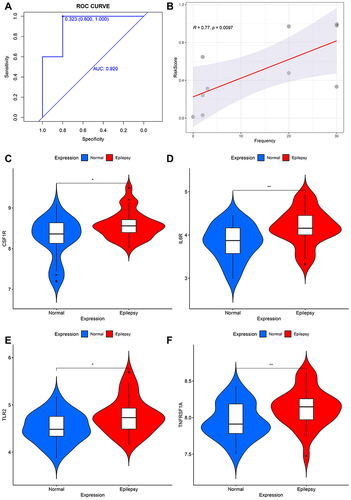
Figure 7 Comparison of infiltrating immune cells between normal samples and epilepsy samples. (A) GSE143272 sets based on CIBERSORTx. (B) GSE143272 sets based on ssGSEA. (C) GESM sets based on ssGSEA.
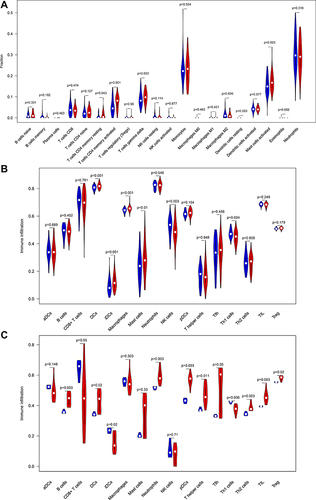
Figure 8 Correlation between hub genes and infiltrating immune cells. (A) GSE143272 sets. (B) GESM sets. Yellow represents common between GESM and GSE143272. *p < 0.05, **p ≤ 0.01, and ***p ≤ 0.001.
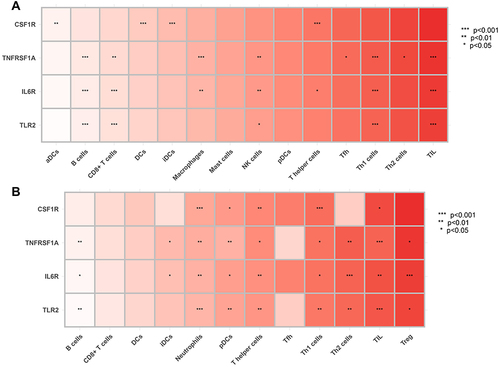
Figure 9 Correlation between hub genes and Th1 cells in GSE143272 sets and GESM sets. (A) Association between CSF1R and Th1 cells in GSE143272 sets. (B) Association between CSF1R and Th1 cells in GESM sets. (C) Association between IL6R and Th1 cells in GSE143272 sets. (D) Association between IL6R and Th1 cells in GESM sets. (E) Association between TLR2 and Th1 cells in GSE143272 sets. (F) Association between TLR2 and Th1 cells in GESM sets. (G) Association between TNFRSF1A and Th1 cells in GSE143272 sets. (H) Association between TNFRSF1A and Th1 cells in GESM sets.
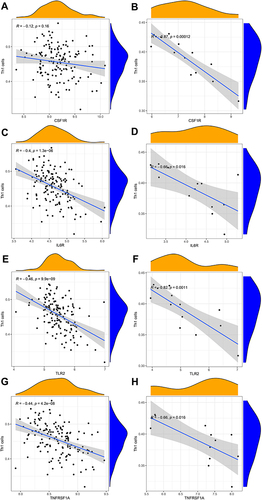
Figure 10 Correlation between hub genes and Th1/Th2 cells in GSE143272 sets and GESM sets. (A) Association between CSF1R and Th1/Th2 cells in GSE143272 sets. (B) Association between CSF1R and Th1/Th2 cells in GESM sets. (C) Association between IL6R and Th1/Th2 cells in GSE143272 sets. (D) Association between IL6R and Th1/Th2 cells in GESM sets. (E) Association between TLR2 and Th1/Th2 cells in GSE143272 sets. (F) Association between TLR2 and Th1/Th2 cells in GESM sets. (G) Association between TNFRSF1A and Th1/Th2 cells in GSE143272 sets. (H) Association between TNFRSF1A and Th1/Th2 cells in GESM sets.
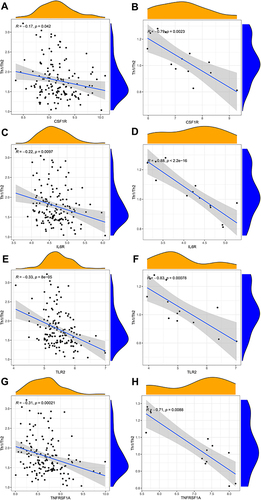
Figure 11 Heatmap displays differences in pathway activities between normal samples and epilepsy samples in GESM datasets. Red indicates epilepsy samples, while blue indicates normal samples.
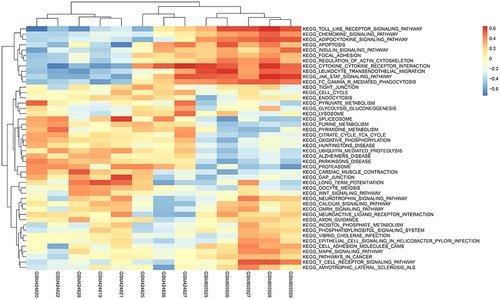
Figure 12 Comparison of the immune-related pathway between normal samples and epilepsy samples. (A) GESM sets. (B) GSE143272 sets.
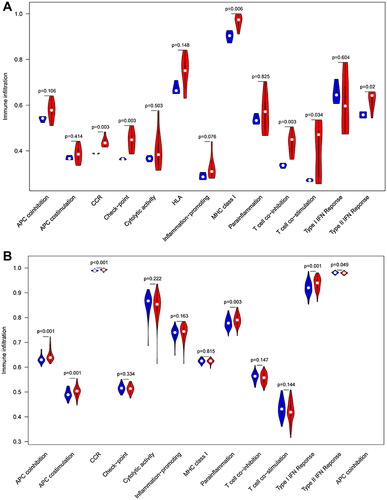
Figure 13 Correlation between hub genes and pivotal molecular pathways. (A) GESM sets based on GSVA. (B) GESM sets based on ssGSEA. (C) GSE143272 sets based on ssGSEA. *p < 0.05, **p ≤ 0.01, and ***p ≤ 0.001.
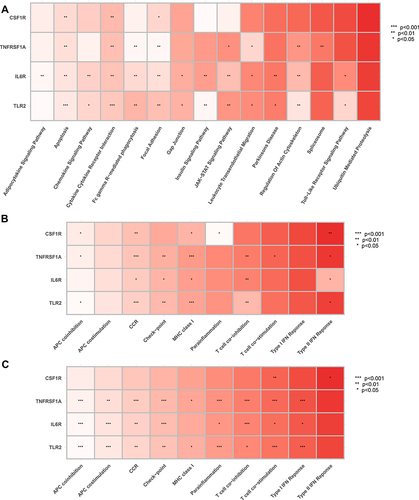
Table 2 List of the 10 Most Significant Small Molecule Drugs That Can Reverse Epilepsy