
Figures & data
Figure 1 WSD fueled more severe inflammatory responses in mice with TNBS-induced colitis.
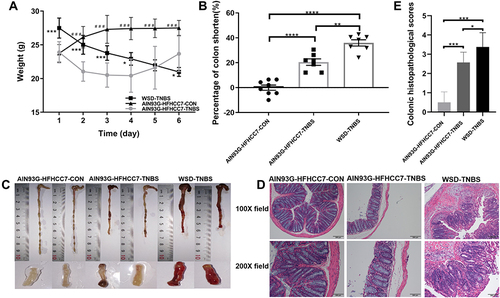
Figure 2 WSD had little effect on intestine before colitis induction.
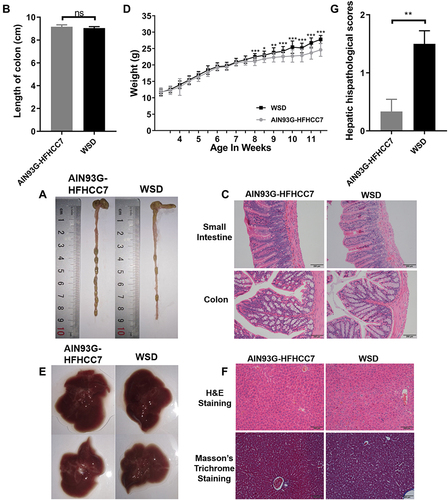
Figure 3 Microarray analysis of genes relative expression changes.
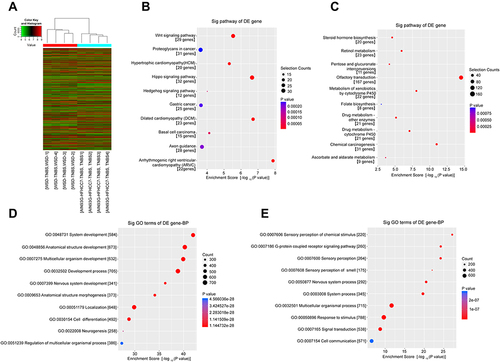
Figure 4 PCA plots of the metabolite profiling of the colonic tissue of mice.
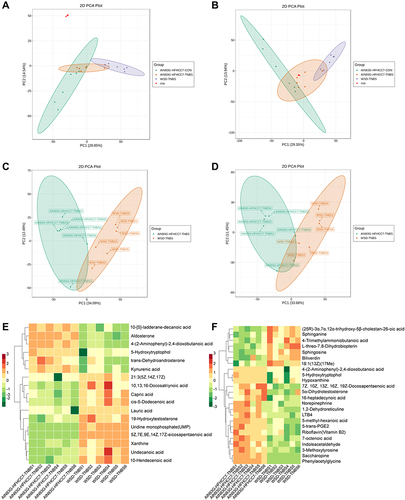
Figure 5 PCA plots of the metabolite profiling of serum of mice.
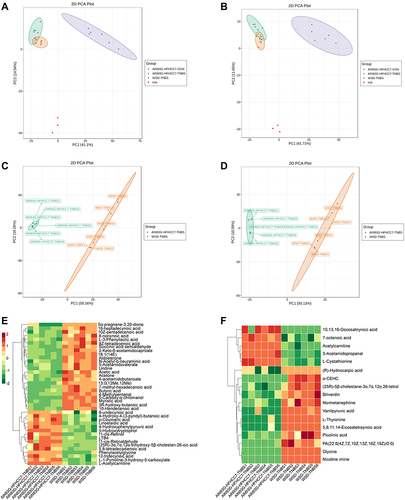
Figure 6 Interaction network of differential transcripts and metabolites in colonic tissue in comparison between the WSD-TNBS group and AIN93G-HFHCC7-TNBS group.
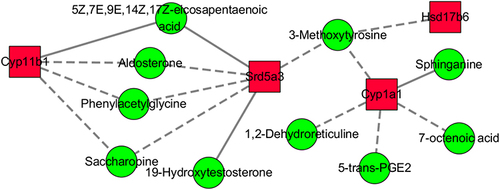
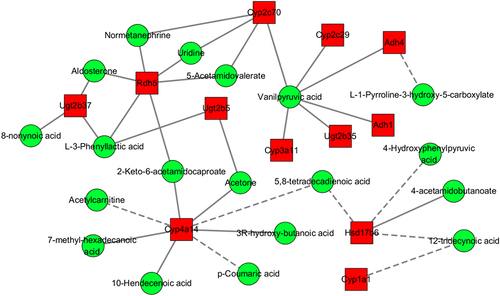
Figure 7 Interaction network of differential transcripts in colonic tissue and differential metabolites in serum in comparison between the WSD-TNBS group and AIN93G-HFHCC7-TNBS group.
Box 1 Hypotheses of WSD Increased Experimental Colitis Susceptibility