Figures & data
Figure 1 Overall design flow chart of experiment.
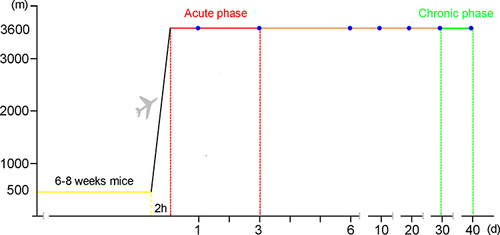
Figure 2 The body weight of mice at D0 (Control), D1, D3, D6, D10, D20, D30, and D40 post high-altitude adaptation. Values are presented as mean ±SD, N=15-30. ****P<0.0001: D1 group, D3 group, D6 group, D10 group, D20 group, D30 group, and D40 group vs Control (D0) group.
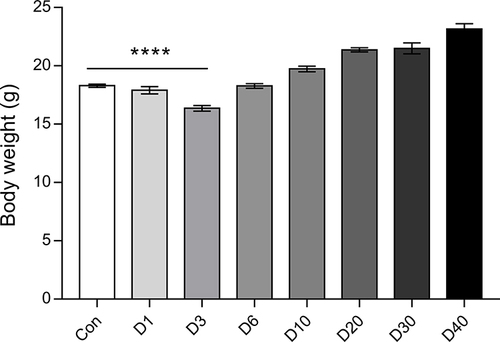
Figure 3 The serum inflammation stress related factors of mice at D0 (Control), D1, D3, D6, D10, D20, D30 and D40 post high-altitude adaptation. (A) The level of serum IL-1. (B) The level of serum IL-6. (C) The level of serum SOD. (D) The level of serum TNF-α. Values are presented as mean ±SD, N=15. *P<0.05, **P<0.01: D1 group, D3 group, D6 group, D10 group, D20 group, D30 group, and D40 group vs Control (D0) group.
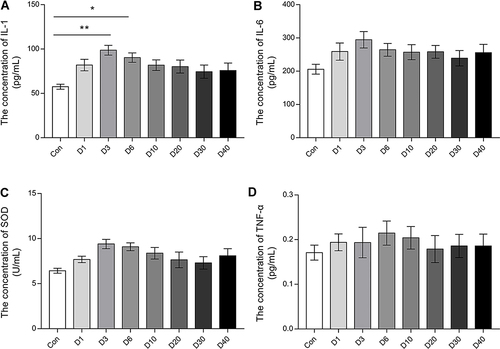
Figure 4 The morphological changes of ocular tissue at D0 (Con), D1, D3, D6, D10, D20, D30 and D40 post high-altitude adaptation. (A) Representative H&E staining picture of ocular tissues (cornea, retina, and choroid). (B) The mean thickness of cornea. (C) The mean thickness of retina. (D) The mean thickness of choroid. Scale bar = 1000/50/25 μm; Values are presented as mean ±SD, N=6. *P<0.05, **P<0.01, ***P<0.001, ****P<0.0001: D1 group, D3 group, D6 group, D10 group, D20 group, D30 group, and D40 group vs Control (D0) group.
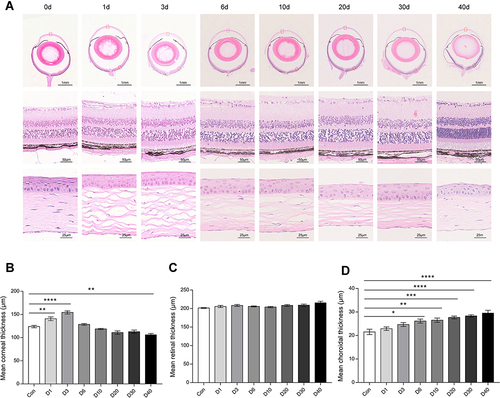
Figure 5 Basic information of quantitative proteomics of ocular tissue at D0 (Control), D1, D3, D6, D10, D20, D30, and D40 post high-altitude adaptation. (A) Total mass spectrometry data. (B) The coverage rate of identified protein. (C) The principal component analysis (PCA) of protein quantification among different groups. (D) Quantitative proteomics identification of differentially abundant proteins with the different fold change at D0 (Control), D1, D3, D6, D10, D20, D30, and D40 post high-altitude adaptation.
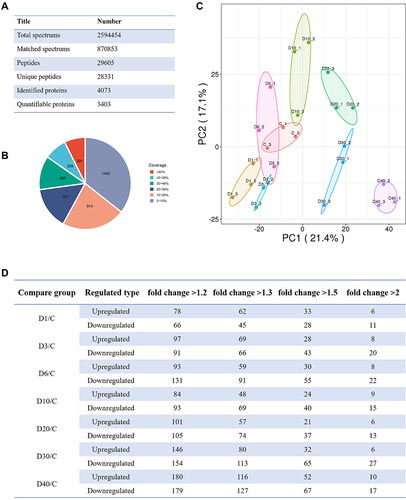
Figure 6 The protein profile changes of ocular tissue during acute high-altitude exposure. (A) The relative expression of upregulation protein profiles at D3 post high-altitude adaptation compared with D0 (Control) shown by heatmap. (B) The relative expression of downregulation protein profiles at D3 post high-altitude adaptation compared with D0 (Control) shown by heatmap. (C) The bubble diagram of the upregulation protein profiles functional enrichment analysis focus on biological process. (D) The bubble diagram of the downregulation protein profiles functional enrichment analysis focus on biological process. For hierarchical row clustering protein data was scaled normalization. Red cell color indicates an upregulation, navy blue cell color indicates a downregulation. The respective color code is given above each heat map. The color of the circle indicated the enrichment significance P-value, and the size of the circle indicated the number of differential proteins in the functional class or pathway.
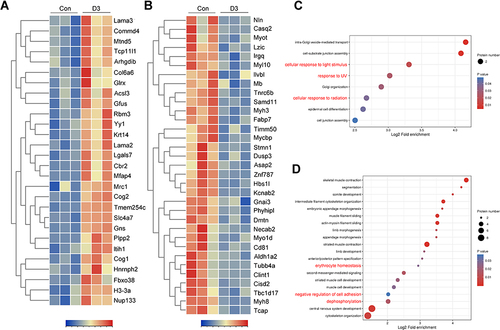
Figure 7 The protein profile changes of ocular tissue during chronic high-altitude exposure. (A) The relative expression of upregulation protein profiles at D40 post high-altitude adaptation compared with D0 (Control) shown by heatmap. (B) The relative expression of downregulation protein profiles at D40 post high-altitude adaptation compared with D0 (Control) shown by heatmap. (C) The bubble diagram of the upregulation protein profiles functional enrichment analysis focus on biological process. (D) The bubble diagram of the downregulation protein profiles functional enrichment analysis focus on biological process. For hierarchical row clustering protein data was scaled normalization. Red cell color indicates an upregulation, navy blue cell color indicates a downregulation. The respective color code is given above each heat map. The color of the circle indicated the enrichment significance P-value, and the size of the circle indicated the number of differential proteins in the functional class or pathway.
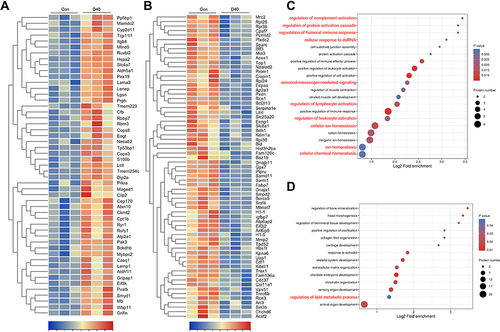
Figure 8 A comparison of ocular tissue proteomic profiles between acute and chronic high-altitude process. (A) Venn diagram showing the overlap of the significantly regulated proteins following 3 days (D3) and 40 days (D40) post high-altitude acclimatization process. (B) Volcano plot showing the differential protein profile between D3 and D40. (C) Subcellular structure annotation of the significantly regulated proteins at D3 and D40. (D) The number of differential proteins based on GO analysis between D3 and D40 post high-altitude exposure.
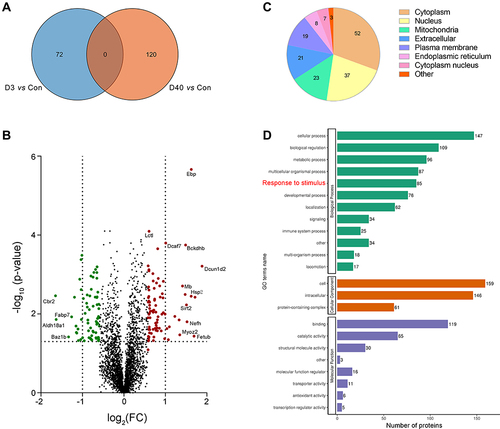
Figure 9 The analysis of cell response related proteins between acute and chronic high-altitude process. (A) The relative expression of differential protein profiles concerning cell stress response at D40 post high-altitude adaptation compared with D3 shown by heatmap. (B) PPI analysis of cell response related proteins between D3 and D40 post high-altitude exposure. For hierarchical row clustering protein data was log2 transformed. Red cell color indicates an upregulation, white cell color a downregulation. The respective color code is given above each heat map.
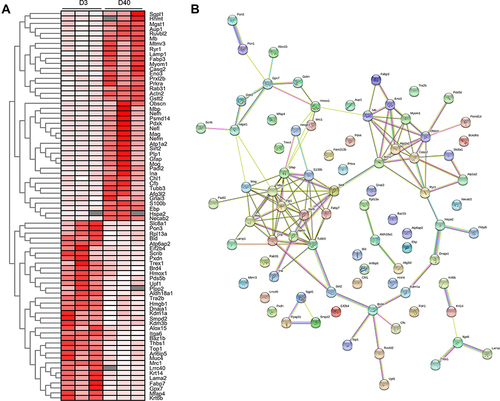
Figure 10 The expression analysis of proteins assigned to the clusters linked with oxidative stress and ferroptosis at D0 (Control), D1, D3, D6, D10, D20, D30, and D40 post high-altitude adaptation. (A) The relative expression of oxidative stress related protein cluster. (B) The relative expression of ferroptosis related protein cluster. For hierarchical row clustering protein data was scaled normalization. Red cell color indicates an upregulation, green cell color a downregulation. The respective color code is given above each heat map. The black, blue, and purple rectangle showed an increased tendency.
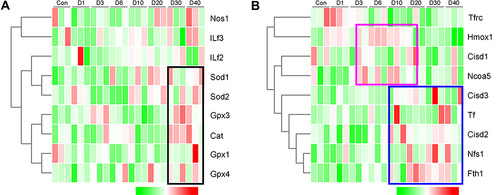
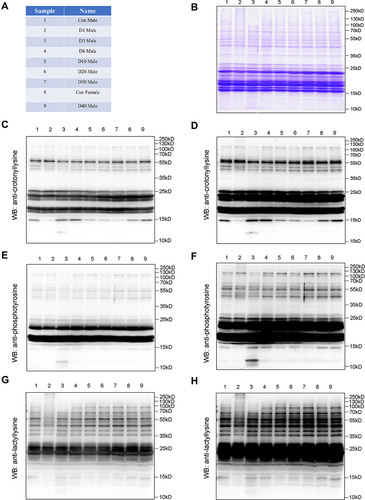
Figure 11 The post-translational modification of ocular tissue at D0 (Control Male), D0 (Control Female) D1, D3, D6, D10, D20, D30, and D40 post high-altitude adaptation. (A) The name of each sample. (B) The Coomassie brilliant blue staining with gels. (C) The expression of lysine crotonylation modification with short exploration. (D) The expression of lysine crotonylation modification with long exploration. (E) The expression of phosphorylation modification with short exploration. (F) The expression of phosphorylation modification with long exploration. (G) The expression of lactylation modification with short exploration. (H) The expression of lactylation modification with long exploration; N=1.